ACT Science Quiz: Comparing Data Sets
15 questions · exam conditions
0:00
Comparing Data SetsQuestion 1 of 15

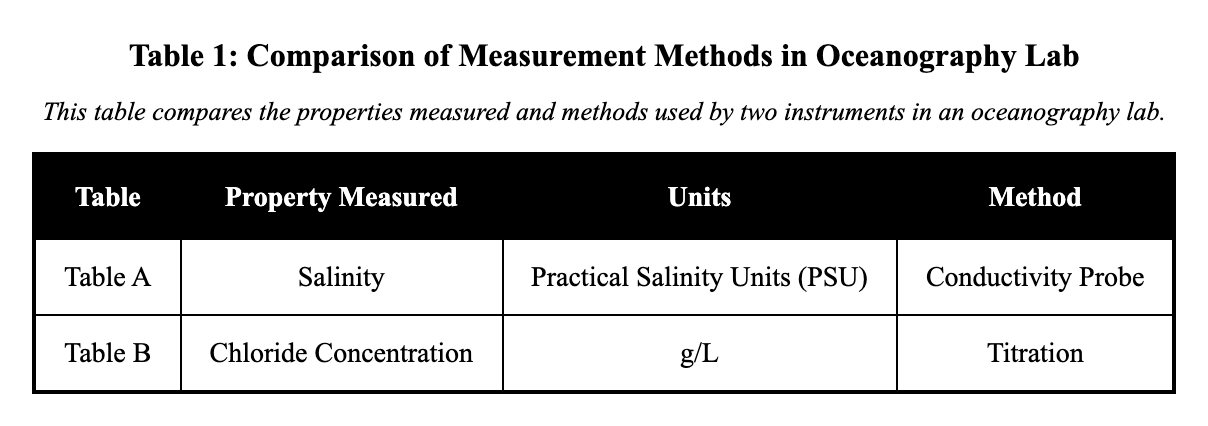
An oceanography lab compared salinity measurements from two instruments. Table A shows salinity measured in practical salinity units (PSU) using a conductivity probe. Table B shows chloride concentration measured in g/L using a titration method at the same depths. Identify the primary difference in what is being measured and how.
Question graphic
Both tables measure chloride, but Table A reports daily averages and Table B reports hourly spikes.
Table A measures chloride (g/L) by titration, while Table B measures salinity (PSU) with a conductivity probe.
Both tables measure salinity in PSU, but Table B uses a different depth scale in centimeters.
Table A measures salinity (PSU) with a conductivity probe, while Table B measures chloride (g/L) by titration at the same depths.
← Back to quizzes

ACT Science Quiz

ACT Science Quiz: Comparing Data Sets

Practice Comparing Data Sets in ACT Science with focused quiz questions that help you check what you know, review explanations, and build confidence with test-style prompts.

What this quiz covers

This quiz focuses on Comparing Data Sets, giving you a quick way to practice the rules, question types, and explanations that matter most for ACT Science.

How to use this quiz

Try each quiz question before looking at the correct answer. Use the explanations to review missed ideas, then come back to similar questions until the pattern feels familiar.

All questions

Question 1

An oceanography lab compared salinity measurements from two instruments. Table A shows salinity measured in practical salinity units (PSU) using a conductivity probe. Table B shows chloride concentration measured in g/L using a titration method at the same depths. Identify the primary difference in what is being measured and how.

  1. Both tables measure chloride, but Table A reports daily averages and Table B reports hourly spikes.
  2. Table A measures chloride (g/L) by titration, while Table B measures salinity (PSU) with a conductivity probe.
  3. Both tables measure salinity in PSU, but Table B uses a different depth scale in centimeters.
  4. Table A measures salinity (PSU) with a conductivity probe, while Table B measures chloride (g/L) by titration at the same depths. (correct answer)

Explanation: The main difference lies in the specific property measured and the method used, even at the same depths. Table A reports salinity in practical salinity units (PSU) using a conductivity probe during a cast; Table B reports chloride concentration in g/L using lab titration of samples. This distinction matters because salinity estimates total salts via conductivity, while chloride measures one component chemically, affecting how data are interpreted for ocean properties. A distractor could swap the methods or variables, but the captions specify conductivity for salinity in A and titration for chloride in B.

Question 2

PASSAGE II

Reaction Rates

Introduction

The rate of a chemical reaction is defined as the speed at which reactants are consumed or products are formed. Students conducted three studies to investigate the factors affecting the rate of the reaction between magnesium ribbon (Mg) and hydrochloric acid (HCl). The reaction produces magnesium chloride (MgCl₂) and hydrogen gas (H₂):

Mg(s)+2HCl(aq)MgCl2(aq)+H2(g)Mg(s) + 2HCl(aq) \rightarrow MgCl_2(aq) + H_2(g)

In each trial, the students placed a specific mass of Mg into a flask containing excess HCl. They measured the time required to collect 50 mL of H₂ gas.

Study 1

In Trials 1–3, the students varied the concentration of the HCl solution while keeping the temperature constant at 20°C. In each trial, a 0.5 g strip of Mg ribbon was used. The results are shown in Table 1.

Study 2

In Trials 4–6, the students varied the temperature of the HCl solution while keeping the concentration constant at 1.0 M. In each trial, a 0.5 g strip of Mg ribbon was used. The results are shown in Table 2.

Study 3

The students investigated the effect of surface area on reaction rate. They performed two trials using 1.0 M HCl at 20°C.

  • Trial 7: Used a 0.5 g strip of Mg ribbon (Low Surface Area).
  • Trial 8: Used 0.5 g of Mg powder (High Surface Area).

In both trials, the total mass of Mg was kept constant at 0.5 g to ensure the same theoretical yield of gas. They measured the volume of gas produced over time. The results are shown in Figure 1.

Compare the results of Trial 2 and Trial 5. Which set of conditions resulted in a faster reaction rate?

  1. Trial 5, because the concentration was lower than in Trial 2.
  2. Trial 2, because the reaction temperature was lower.
  3. Trial 5, because the temperature was higher than in Trial 2.
  4. Trial 2, because it took 40 seconds to collect the gas, whereas Trial 5 took 42 seconds. (correct answer)

Explanation: Reaction rate and time are inversely related here: since every trial collects the same 50 mL of H2, the trial that needs less time has the faster rate. Trial 2 used 2.0 M HCl at 20 degrees Celsius and took 40 s, while Trial 5 used 1.0 M HCl at 35 degrees Celsius and took 42 s, so Trial 2 was faster because 40 s is less than 42 s — that timing comparison is the whole justification. The tempting mistake is reasoning that Trial 5 must be faster because its temperature was higher; raising temperature does speed reactions up in general, but Trial 2 also has double the concentration, and the recorded times settle the question. Saying Trial 5 was faster because its concentration was lower gets the chemistry backwards, since lower concentration slows the reaction. And claiming Trial 2 was faster because its temperature was lower attaches a correct conclusion to a reason that contradicts the data, where 20 degrees Celsius took the longest at 85 s. Always check the measured times before reasoning from which variable should win.

Question 3

PASSAGE II

BIOLOGY: Research Summary

Introduction

Transpiration is the process by which moisture is carried through plants from roots to small pores on the underside of leaves, where it changes to vapor and is released to the atmosphere. A botanist conducted two studies to investigate how environmental factors affect the transpiration rate of Spathiphyllum (peace lily) plants.

Study 1

The botanist placed 5 identical Spathiphyllum plants into 5 identical environmentally controlled chambers. The relative humidity inside all chambers was kept constant at 40%, and the temperature was kept constant at 22°C. The botanist varied the light intensity—measured in micromoles of photons per square meter per second (μmol/m2/s\mu mol/m^2/s)—in each chamber. After 4 hours, the botanist measured the mass of water lost by each plant to calculate the transpiration rate in milligrams of water per square centimeter of leaf area per hour (mg/cm2/hrmg/cm^2/hr). Results are shown in Table 1.

Study 2

The botanist obtained 5 new, identical Spathiphyllum plants and placed them in the chambers. This time, the light intensity in all chambers was kept constant at 400 μmol/m2/s\mu mol/m^2/s and the temperature at 22°C. The botanist varied the relative humidity in each chamber. The transpiration rates were calculated after 4 hours. Results are shown in Table 2.

Consider the plant in Chamber 3 and the plant in Chamber 7. Which of the following statements about these two plants is most accurate?

  1. The plant in Chamber 3 experienced a higher temperature than the plant in Chamber 7.
  2. The plant in Chamber 7 was exposed to a higher light intensity than the plant in Chamber 3.
  3. Both plants were exposed to the same environmental conditions (40% humidity and 400 μmol/m²/s light) and had the same transpiration rate of 4.8 mg/cm²/hr. (correct answer)
  4. The plant in Chamber 3 had a transpiration rate of 6.5, while the plant in Chamber 7 had a transpiration rate of 4.8.

Explanation: The correct answer is C. Chamber 3 was in Study 1: light intensity was varied, humidity was constant at 40%, and Chamber 3 received 400 μmol/m²/s light, producing a transpiration rate of 4.8. Chamber 7 was in Study 2: humidity was varied, light intensity was constant at 400 μmol/m²/s, and Chamber 7 had 40% humidity, also producing 4.8. Both plants were therefore exposed to identical conditions (400 light, 40% humidity) and produced identical transpiration rates. A is wrong — temperature was held constant at 22°C in both studies. B is wrong — both chambers received 400 μmol/m²/s. D is wrong — 6.5 corresponds to Chamber 6 (20% humidity), not Chamber 3. Pro tip: Cross-study comparison questions require identifying the controlled variables in each study and checking whether they match the comparison point.

Question 4

A geology lab compared two methods for estimating rock density. Table A lists measured mass and volume for rock samples using a balance and water displacement. Table B lists calculated density for the same samples using ρmassˉ/volume\rho\=\text{mass}/\text{volume}. Identify the relationship.

  1. Table A reports water temperature and meniscus height, while Table B reports mass from a balance.
  2. Both tables list density, but Table B uses SI units (kg/m3^3) instead of g/cm3^3.
  3. Table B lists measured mass and volume, while Table A lists calculated density using a different formula.
  4. Table B lists density calculated from Table A's measured mass and volume for the same rock samples. (correct answer)

Explanation: Table B computes density from the raw mass and volume measurements provided in Table A for the same rock samples. Table A lists measured mass in grams (g) from a balance and volume in cm³ from water displacement for four samples; Table B lists density in g/cm³ calculated as mass divided by volume. This derivation matters because density summarizes a material property independent of sample size, facilitating comparisons that raw measurements alone do not. A distractor might reverse the measured and calculated roles, but the captions specify A as primary data and B as computed.

Question 5

PASSAGE VI

PHYSICS: This passage is adapted from a study on the forces acting on an object on an inclined plane. Introduction

A student conducted experiments to determine the factors that affect the force required to pull a block up an inclined plane at a constant velocity. The force (FF) required depends on the mass of the block (mm), the angle of the incline (θ\theta), and the friction between the block and the surface.

The experimental setup consisted of a wooden board (the inclined plane) and a spring scale attached to a rectangular block. The student pulled the block up the incline at a steady speed and recorded the force in Newtons (N).

Study 1

To test how the angle of the incline affects the force, the student used a standard wooden block with a mass of 1.0 kg. The surface of the inclined plane was smooth wood. The student varied the angle of the incline from 10° to 60°. Results were recorded in Table 1.

Study 2

To test how the surface material (friction) affects the force, the student fixed the angle of the incline at 30° and used the same 1.0 kg block. The student covered the wooden board with different materials: Sandpaper, Rubber, and Plastic. The force was measured for each surface. Results were recorded in Table 2.

Study 3

To test how the mass of the block affects the force, the student used the smooth wood surface and fixed the angle at 30°. The student added weights to the block to increase its total mass. Results were recorded in Table 3.

Based on Table 2, which surface material created the greatest resistance (friction) to the movement of the block?

  1. Smooth Wood
  2. Plastic
  3. Sandpaper
  4. Rubber (correct answer)

Explanation: This is a data comparison question requiring you to understand that higher force indicates higher friction. Table 2 shows forces for different surfaces: Smooth Wood (5.8 N), Plastic (6.0 N), Sandpaper (8.2 N), and Rubber (9.5 N). Since friction opposes motion and requires more force to overcome, the surface with the highest force has the greatest friction. Rubber at 9.5 N is highest. Choice D is correct. The other choices show lower forces and therefore lower friction. Pro tip: In physics contexts, resistance to motion correlates with higher force needed to maintain constant velocity.

Question 6

PASSAGE IV

CHEMISTRY: Research Summary

Introduction

Colligative properties are properties of a solution that depend on the ratio of the number of solute particles to the number of solvent molecules, and not on the identity of the solute. Two common colligative properties are freezing point depression (a lowering of the freezing point) and boiling point elevation (an increase in the boiling point).

At standard atmospheric pressure (1 atm), pure liquid water (H2OH_2O) has a freezing point of 0.00C0.00^\circ\text{C} and a boiling point of 100.00C100.00^\circ\text{C}. Students conducted two studies to investigate how adding different solutes to 1.00 kilogram (kg) of water affects these points.

Study 1

Sodium chloride (NaCl) is a salt that completely dissociates (breaks apart) into two separate ions (Na+Na^+ and ClCl^-) when dissolved in water. The students added varying amounts of NaCl, measured in moles (mol), to 1.00 kg of water. They measured the resulting freezing point and boiling point of the solutions. Measurements are shown in Table 1.

Study 2

The students wanted to see how the number of particles a molecule dissociates into (nn) affects the freezing and boiling points. They gathered three different solutes:

•Sucrose (C12H22O11C_{12}H_{22}O_{11}): Does not dissociate in water (n \= 1).

Sodium chloride (NaCl): Dissociates into 2 ions (n \= 2).

Magnesium chloride (MgCl2MgCl_2): Dissociates into 3 ions (Mg2+Mg^{2+} and two ClCl^- ions) (n \= 3).

They added exactly 1.00 mole of each solute to separate beakers containing 1.00 kg of water and recorded the results. Findings are shown in Table 2.

A student hypothesizes that a solution containing 1.50 moles of NaCl will have the exact same freezing point and boiling point as a solution containing 1.00 mole of MgCl₂. Is this hypothesis supported by the data in Tables 1 and 2?

  1. Yes; both solutions yield a freezing point of −5.58°C and a boiling point of 101.53°C. (correct answer)
  2. Yes; both solutions yield a freezing point of −3.72°C and a boiling point of 101.02°C.
  3. No; the 1.50 mole NaCl solution has a lower freezing point than the 1.00 mole MgCl₂ solution.
  4. No; the 1.00 mole MgCl₂ solution has a lower freezing point than the 1.50 mole NaCl solution.

Explanation: The correct answer is A. From Table 1: 1.50 moles of NaCl yields a freezing point of −5.58°C and boiling point of 101.53°C. From Table 2: 1.00 mole of MgCl₂ (n=3) yields a freezing point of −5.58°C and boiling point of 101.53°C. The hypothesis is supported. The underlying reason: colligative properties depend on total dissolved particles. 1.50 mol NaCl × 2 ions = 3.00 mol particles; 1.00 mol MgCl₂ × 3 ions = 3.00 mol particles. Equal particle counts produce identical effects. B incorrectly uses the 1.00 mol NaCl values. C and D both claim the solutions differ when in fact they are identical. Pro tip: The most challenging synthesis questions require looking up values in two separate tables simultaneously. Do both lookups before evaluating the hypothesis.

Question 7

PASSAGE I

CHEMISTRY: This passage is adapted from a study on the solubility of various substances in water.

Solubility is defined as the maximum amount of a solute (substance being dissolved) that can dissolve in a specific amount of solvent (usually water) at a given temperature. The solubility of most solids increases with temperature, while the solubility of most gases decreases with temperature. A student performed an experiment to measure the solubility of three solid salts—Potassium Nitrate (KNO3KNO_3), Sodium Chloride (NaClNaCl), and Cerium(III) Sulfate (Ce2(SO4)3Ce_2(SO_4)_3)—and one gas, Oxygen (O2O_2).

Based on Figures 1 and 2, which substance behaves most similarly to Oxygen gas (O₂) in terms of how its solubility changes with temperature?

  1. KNO₃
  2. NaCl
  3. Ce₂(SO₄)₃ (correct answer)
  4. None of the solids behave like the gas.

Explanation: This is a cross-figure synthesis question requiring you to compare trends across two different graphs. Figure 2 shows O₂ solubility decreases as temperature increases (downward-sloping curve). Looking at Figure 1, you need to find which solid also shows decreasing solubility with increasing temperature. KNO₃ increases dramatically, NaCl stays nearly flat, but Ce₂(SO₄)₃ decreases from 20 g at 0°C to 5 g at 100°C. This downward trend matches O₂'s behavior. Choice C is correct. Choices A and B show opposite or neutral trends. Choice D is incorrect because Ce₂(SO₄)₃ does behave similarly. Pro tip: For similarity questions, identify the key pattern (here: decreasing with temperature) and find the match.

Question 8

PASSAGE V

BIOLOGY: Data Representation

Introduction

Photosynthesis is the process by which plants use light energy to synthesize glucose. Plants capture light energy using pigment molecules located in their leaves. Different pigments absorb different wavelengths of visible light. The visible light spectrum ranges from 400 nanometers (nm), which is violet light, to 700 nm, which is red light. Light that is not absorbed is reflected (which determines the color the plant appears to the human eye).

A botanist investigated the light absorption and photosynthetic activity of a specific species of green plant.

Study 1

The botanist extracted the three primary photosynthetic pigments from the plant's leaves: Chlorophyll a, Chlorophyll b, and Carotenoids. Figure 1 shows the absorption spectrum for each pigment, which indicates the relative amount of light absorbed by each pigment at different wavelengths.

Study 2

The botanist then measured the overall action spectrum of the living, intact plant. The action spectrum shows the actual relative rate of photosynthesis (measured by oxygen production) for the whole plant when it is exposed to different wavelengths of light. Findings are shown in Figure 2

By comparing Figure 1 and Figure 2, what explains the fact that the plant maintains a 25% relative rate of photosynthesis at 500 nm, even though both Chlorophyll a and Chlorophyll b have an absorption rate of nearly 0% at that wavelength?

  1. Carotenoids are absorbing light in the 500 nm range and contributing that energy to the photosynthetic process. (correct answer)
  2. The plant switches from photosynthesis to cellular respiration at 500 nm.
  3. The plant uses heat energy from the surrounding environment to compensate for the lack of light absorption.
  4. Chlorophyll b mutates at 500 nm to absorb red light instead.

Explanation: The correct answer is A. Figure 1 shows that while Chlorophyll a and b both have near-zero absorption at 500 nm, Carotenoids have 'a broad absorption peak stretching from 450 nm to 500 nm' — meaning Carotenoids are absorbing light at exactly the wavelengths where the chlorophylls cannot. Figure 2 then shows that the whole plant still maintains about 25% photosynthetic activity at 500 nm. The only explanation that reconciles these two observations is that the Carotenoids are capturing the 500 nm light and transferring that energy to the photosynthetic machinery. B is wrong — the passage never mentions cellular respiration, and photosynthesis and respiration are distinct processes. C is wrong — heat energy is not a substitute for light energy in photosynthesis. D is wrong — there is no evidence for pigment mutation in the passage. Pro tip: Figure-comparison questions are solved by identifying what each figure shows, then finding the one answer that requires information from both figures simultaneously.

Question 9

PASSAGE IV

GEOPHYSICS: This passage is adapted from a study on the structure of Earth's interior using seismic waves.

Seismologists study the interior of the Earth by analyzing the propagation of seismic waves generated by earthquakes. There are two main types of body waves:

•P-waves (Primary waves): Compressional waves that travel through solids, liquids, and gases.

•S-waves (Secondary waves): Shear waves that travel only through solids.

The velocity of these waves depends on the density and physical state (solid or liquid) of the material they travel through. Abrupt changes in velocity indicate boundaries between Earth's layers.

Based on Figures 1 and 2, the sharp increase in density at a depth of 5,100 km corresponds to which change in P-wave velocity?

  1. A decrease from 13 km/s to 8 km/s.
  2. A decrease from 10 km/s to 0 km/s.
  3. An increase from 10 km/s to 11 km/s. (correct answer)
  4. An increase from 8 km/s to 13 km/s.

Explanation: This is a cross-figure synthesis question. You need to examine both figures at the same depth (5,100 km, the Outer Core/Inner Core boundary). Figure 2 shows density jumping from 12.0 to 13.0 g/cm³. Figure 1 shows the P-wave curve jumping from approximately 10 km/s (end of Outer Core) to approximately 11 km/s (beginning of Inner Core). Choice C correctly describes this change. Choices A and D describe changes at the wrong boundary (2,900 km). Choice B describes S-wave behavior, not P-wave. Pro tip: For cross-figure questions, carefully identify the same location on both graphs.

Question 10

Researchers tested an enzyme's activity under different acidity conditions. Table A lists measured reaction rate at several pH values using a spectrophotometer. Table B lists measured reaction rate at the same pH values but at a higher temperature. Determine the primary relationship between the tables.

  1. Table B repeats Table A but at a higher temperature, so rates can be compared across temperatures at each pH. (correct answer)
  2. Table A reports temperature dependence, while Table B reports pH dependence of a different enzyme.
  3. Table B converts Table A's rates into different units, without changing temperature or conditions.
  4. Table A reports calculated rates, while Table B reports measured rates using a different instrument.

Explanation: Table A and Table B both measure enzyme reaction rates under varying pH conditions, but Table B does so at a higher temperature to isolate temperature effects. Table A reports rates in µmol/min at 25°C across four pH values using a spectrophotometer with consistent enzyme and substrate amounts; Table B reports rates in the same units at 37°C for the same pH values and conditions. This setup matters because it allows direct comparison of temperature's impact on rate at each pH, highlighting how environmental factors influence enzyme activity. A distractor could claim unit conversion without temperature change, but the captions emphasize the temperature difference as the key variable.

Question 11

A public health team summarized flu vaccination in two age groups. Table A shows counts of vaccinated and unvaccinated people in a sample of adults ages 18–49. Table B shows percentages vaccinated and unvaccinated in a separate sample of adults ages 65+. Determine how the tables differ in both population and reporting format.

  1. Table A gives counts for ages 18–49, while Table B gives percentages for ages 65+ from a different sample. (correct answer)
  2. Table A gives percentages for ages 65+, while Table B gives counts for ages 18–49 from the same sample.
  3. Both tables give counts, but Table B includes two additional vaccination categories not shown in Table A.
  4. Both tables describe the same age group, but Table B uses different vaccine types instead of vaccination status.

Explanation: Table A and Table B differ in both the age groups surveyed and the format of reporting vaccination status. Table A reports counts of vaccinated and unvaccinated individuals in a sample of adults ages 18–49; Table B reports percentages of vaccinated and unvaccinated in a separate sample of adults ages 65+. This difference matters because counts show raw sample sizes while percentages normalize for comparison, and separate age groups highlight demographic variations in vaccination rates. A distractor might reverse the age groups or formats, but the captions clearly assign counts to younger adults in A and percentages to older in B.

Question 12

A biology class examined plant growth under different light colors. Table A shows mean plant height after 14 days under red, blue, or white LEDs (n=10 per group). Table B shows mean leaf count after 14 days under the same light treatments (n=10 per group). Compare what variable each table measures.

  1. Table A measures height in centimeters, while Table B measures leaf number under the same light treatments and duration. (correct answer)
  2. Table A measures leaf number, while Table B measures height for different light colors and different sample sizes.
  3. Both tables measure height, but Table B reports median instead of mean values.
  4. Table A reports light intensity, while Table B reports plant growth rate per hour.

Explanation: Table A and Table B measure different growth variables under identical light treatments and durations to compare aspects of plant response. Table A reports mean plant height in centimeters (cm) after 14 days under red, blue, or white LEDs with n=10 per group using a ruler; Table B reports mean leaf count (unitless) after 14 days under the same conditions and sample size via visual inspection. This distinction matters because height reflects vertical growth while leaf count indicates developmental progress, allowing multifaceted analysis of light effects. A distractor might suggest different treatments or variables like intensity, but both tables share the same light colors and time frame.

Question 13

PASSAGE VI

PHYSICS: This passage is adapted from a study on the forces acting on an object on an inclined plane. Introduction

A student conducted experiments to determine the factors that affect the force required to pull a block up an inclined plane at a constant velocity. The force (FF) required depends on the mass of the block (mm), the angle of the incline (θ\theta), and the friction between the block and the surface.

The experimental setup consisted of a wooden board (the inclined plane) and a spring scale attached to a rectangular block. The student pulled the block up the incline at a steady speed and recorded the force in Newtons (N).

Study 1

To test how the angle of the incline affects the force, the student used a standard wooden block with a mass of 1.0 kg. The surface of the inclined plane was smooth wood. The student varied the angle of the incline from 10° to 60°. Results were recorded in Table 1.

Study 2

To test how the surface material (friction) affects the force, the student fixed the angle of the incline at 30° and used the same 1.0 kg block. The student covered the wooden board with different materials: Sandpaper, Rubber, and Plastic. The force was measured for each surface. Results were recorded in Table 2.

Study 3

To test how the mass of the block affects the force, the student used the smooth wood surface and fixed the angle at 30°. The student added weights to the block to increase its total mass. Results were recorded in Table 3.

Based on Table 2, which surface material created the greatest resistance (friction) to the movement of the block?

  1. Smooth Wood
  2. Plastic
  3. Sandpaper
  4. Rubber (correct answer)

Explanation: This is a data comparison question requiring you to understand that higher force indicates higher friction. Table 2 shows forces for different surfaces: Smooth Wood (5.8 N), Plastic (6.0 N), Sandpaper (8.2 N), and Rubber (9.5 N). Since friction opposes motion and requires more force to overcome, the surface with the highest force has the greatest friction. Rubber at 9.5 N is highest. Choice D is correct. The other choices show lower forces and therefore lower friction. Pro tip: In physics contexts, resistance to motion correlates with higher force needed to maintain constant velocity.

Question 14

PASSAGE I

CHEMISTRY: This passage is adapted from a study on the solubility of various substances in water.

Solubility is defined as the maximum amount of a solute (substance being dissolved) that can dissolve in a specific amount of solvent (usually water) at a given temperature. The solubility of most solids increases with temperature, while the solubility of most gases decreases with temperature. A student performed an experiment to measure the solubility of three solid salts—Potassium Nitrate (KNO3KNO_3), Sodium Chloride (NaClNaCl), and Cerium(III) Sulfate (Ce2(SO4)3Ce_2(SO_4)_3)—and one gas, Oxygen (O2O_2).

Based on Figures 1 and 2, which substance behaves most similarly to Oxygen gas (O₂) in terms of how its solubility changes with temperature?

  1. KNO₃
  2. NaCl
  3. Ce₂(SO₄)₃ (correct answer)
  4. None of the solids behave like the gas.

Explanation: This is a cross-figure synthesis question requiring you to compare trends across two different graphs. Figure 2 shows O₂ solubility decreases as temperature increases (downward-sloping curve). Looking at Figure 1, you need to find which solid also shows decreasing solubility with increasing temperature. KNO₃ increases dramatically, NaCl stays nearly flat, but Ce₂(SO₄)₃ decreases from 20 g at 0°C to 5 g at 100°C. This downward trend matches O₂'s behavior. Choice C is correct. Choices A and B show opposite or neutral trends. Choice D is incorrect because Ce₂(SO₄)₃ does behave similarly. Pro tip: For similarity questions, identify the key pattern (here: decreasing with temperature) and find the match.

Question 15

PASSAGE IV

GEOPHYSICS: This passage is adapted from a study on the structure of Earth's interior using seismic waves.

Seismologists study the interior of the Earth by analyzing the propagation of seismic waves generated by earthquakes. There are two main types of body waves:

•P-waves (Primary waves): Compressional waves that travel through solids, liquids, and gases.

•S-waves (Secondary waves): Shear waves that travel only through solids.

The velocity of these waves depends on the density and physical state (solid or liquid) of the material they travel through. Abrupt changes in velocity indicate boundaries between Earth's layers.

Based on Figures 1 and 2, the sharp increase in density at a depth of 5,100 km corresponds to which change in P-wave velocity?

  1. A decrease from 13 km/s to 8 km/s.
  2. A decrease from 10 km/s to 0 km/s.
  3. An increase from 10 km/s to 11 km/s. (correct answer)
  4. An increase from 8 km/s to 13 km/s.

Explanation: This is a cross-figure synthesis question. You need to examine both figures at the same depth (5,100 km, the Outer Core/Inner Core boundary). Figure 2 shows density jumping from 12.0 to 13.0 g/cm³. Figure 1 shows the P-wave curve jumping from approximately 10 km/s (end of Outer Core) to approximately 11 km/s (beginning of Inner Core). Choice C correctly describes this change. Choices A and D describe changes at the wrong boundary (2,900 km). Choice B describes S-wave behavior, not P-wave. Pro tip: For cross-figure questions, carefully identify the same location on both graphs.