All questions
Question 1
PASSAGE VII
PHYSICS: Data Representation
Introduction
A student investigated the relationship between voltage (V), current (I), and resistance (R) in a simple direct current (DC) electrical circuit.
•Voltage (V) is the electrical potential difference provided by a power source, measured in volts (V).
•Current (I) is the rate of flow of electrical charge, measured in amperes (A).
•Resistance (R) is the opposition to the flow of charge, measured in ohms (Ω).
The student set up a circuit containing a variable voltage power supply, a resistor, and an ammeter (a device used to measure current).
Experiment 1
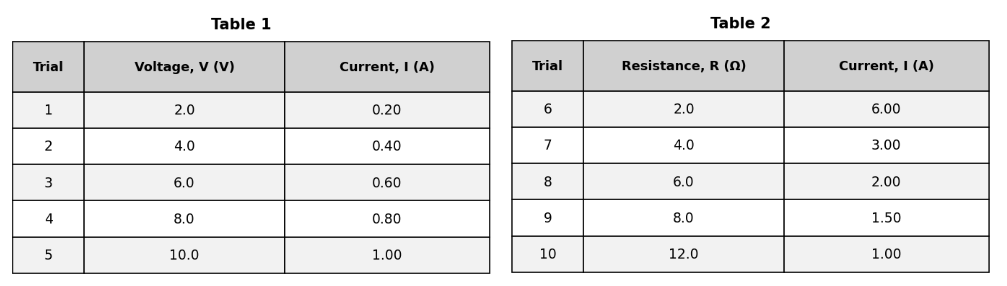
In the first experiment, the student used a resistor with a constant resistance of 10.0 Ω. The student varied the voltage supplied to the circuit from 2.0 V to 10.0 V and recorded the resulting current measured by the ammeter. Results are shown in Table 1.
Experiment 2
In the second experiment, the student set the power supply to provide a constant voltage of 12.0 V. The student then swapped out the resistor, testing five different resistors with varying resistance values, and recorded the resulting current for each. Results are shown in Table 2.
Which of the following variables was intentionally held constant in the experiment that produced the data in Table 1?
- The current (I)
- The voltage (V)
- The resistance (R) (correct answer)
- The type of power supply
Explanation: The correct answer is C (the resistance R). The introduction to Table 1 explicitly states: 'the student used a resistor with a constant resistance of 10.0 Ω.' This was held fixed so that the effect of changing voltage on current could be isolated. A (current) is the dependent variable being measured — it changes in response to voltage changes and is not held constant. B (voltage) is the independent variable being deliberately varied across trials. H correctly identifies resistance as the controlled constant. D (type of power supply) is not mentioned as a variable in the study and while presumably constant, it is not the primary experimental control that was intentionally fixed to isolate the relationship. On controlled-variable questions, look for the explicit statement in the study introduction identifying what was kept constant.
Question 2
PASSAGE VI
BIOLOGY / GENETICS: Research Summary
Introduction
Restriction enzymes are proteins that cut DNA molecules at specific, predictable sequences of base pairs (bp). Gel electrophoresis is a technique used to separate these resulting DNA fragments by size. When an electrical current is applied to the gel, the negatively charged DNA fragments migrate toward the positive electrode. Smaller DNA fragments move through the gel much faster and travel further than larger fragments.
A researcher isolated a circular bacterial plasmid (a ring of DNA) consisting of exactly 5,000 bp. To map the plasmid, the researcher treated identical samples of the plasmid with different restriction enzymes—Enzyme 1 (E1), Enzyme 2 (E2), and Enzyme 3 (E3)—both individually and in combinations.
After allowing the enzymes to cut the DNA, the researcher ran the samples on an electrophoresis gel. A dye was added to make the DNA bands visible. The size of the fragments in each band was recorded in Table 1.
During gel electrophoresis, which property of the DNA fragments primarily determines how far they migrate through the gel?
- Their electrical charge
- Their restriction enzyme binding site
- Their length in base pairs (correct answer)
- Their rate of mutation
Explanation: The correct answer is C (their length in base pairs). The passage explicitly states: 'Smaller DNA fragments move through the gel much faster and travel further than larger fragments.' Size — measured in base pairs — is the primary determinant of migration distance. All DNA fragments carry a negative charge (this is why they migrate toward the positive electrode), so electrical charge is essentially the same for all fragments and does not distinguish how far they travel. F (electrical charge) is what causes all DNA to move toward the positive electrode, but it does not explain why different-sized fragments travel different distances. G (restriction enzyme binding sites) are the sequences where enzymes cut the DNA — these are properties of the sequence, not migration distance. J (rate of mutation) is irrelevant to electrophoresis migration.
Question 3
A microbiology student tested whether disinfectant concentration affects bacterial survival on plastic. She prepared four spray bottles containing the same disinfectant at 0%, 25%, 50%, and 75% concentration (diluted with sterile water). Identical plastic squares were inoculated with the same volume of bacterial culture and left for 5 minutes. Each square was sprayed with exactly 2.0 mL of solution from its bottle and left for 2 minutes before being swabbed. The swab was streaked onto agar plates that were incubated at 37°C for 24 hours. The student counted the number of colonies that grew on each plate. In this experiment, the dependent variable is:
- Disinfectant concentration used
- Number of bacterial colonies after incubation (correct answer)
- Volume sprayed onto each plastic square
- Incubation temperature (37°C)
Explanation: In this experiment, the independent variable is the disinfectant concentration (0%, 25%, 50%, 75%), the dependent variable is the number of bacterial colonies after incubation, and controlled variables include the volume sprayed (2.0 mL), incubation temperature (37°C), plastic square type, bacterial culture volume, inoculation time (5 minutes), exposure time (2 minutes), agar plates, and incubation time (24 hours). The independent variable is manipulated to test its efficacy, the dependent variable is counted to assess bacterial survival, and controlled variables are maintained constant to ensure the results reflect only the concentration's impact. Choice B correctly identifies the number of bacterial colonies as the dependent variable because it was the measured outcome responding to different concentrations. Choice D is a distractor as it represents a controlled variable, the fixed incubation temperature, not the dependent variable.
Question 4
A student investigated how salt concentration affects the boiling point of water. She prepared four 250 mL beakers, each containing 200 mL of distilled water. She added table salt to make solutions of 0%, 2%, 4%, and 6% salt by mass. Each beaker was heated on the same hot plate setting, starting at room temperature (22°C). The student stirred each solution at a constant rate with the same glass rod and recorded the temperature when the liquid reached a steady rolling boil for 30 seconds. She used the same thermometer for all trials and measured boiling point to the nearest 0.1°C. Which of the following is the independent variable?
- Hot plate model used
- Volume of water in each beaker
- Salt concentration of the solution (correct answer)
- Temperature at which boiling began
Explanation: In this experiment, the independent variable is the salt concentration of the solution, which was varied at 0%, 2%, 4%, and 6%; the dependent variable is the temperature at which boiling began, which was measured for each solution; and controlled variables include the volume of water (200 mL in each beaker), the hot plate model and setting, the starting temperature (22°C), stirring rate, and thermometer used. The independent variable is the factor deliberately manipulated by the experimenter to observe its effect, the dependent variable is the outcome measured to see the response, and controlled variables are kept constant across trials to ensure the results are due to the independent variable alone. Choice C correctly identifies the salt concentration as the independent variable because it was systematically changed while other factors were held steady. Choice D is a distractor as it represents the dependent variable, which is the measured boiling temperature, not the manipulated factor.
Question 5
A student tested how the temperature of water affects the time it takes a tablet to dissolve. She placed one identical effervescent tablet into 200 mL of water at each of four temperatures: 10°C, 20°C, 30°C, and 40°C. She used the same beaker type, did not stir the water in any trial, and used the same brand of tablets. She started a timer when the tablet touched the water and stopped the timer when bubbling ceased and no solid remained. Which of the following is the independent variable?
- Brand of effervescent tablet
- Water temperature (correct answer)
- Volume of water (200 mL)
- Time for the tablet to dissolve
Explanation: In this experiment, the independent variable is the water temperature (10°C, 20°C, 30°C, and 40°C), the dependent variable is the time for the tablet to dissolve, and controlled variables include the volume of water (200 mL), beaker type, lack of stirring, tablet brand, and tablet size (identical effervescent tablets). The independent variable is the factor varied to test its impact, the dependent variable is the measured effect of that variation, and controlled variables are maintained constant to ensure the experiment's validity. Choice B correctly identifies water temperature as the independent variable because it was systematically changed to observe its effect on dissolution time. Choice C is a distractor as it represents a controlled variable, the fixed water volume, which was not manipulated.
Question 6
A student investigated how fertilizer amount affects algae growth in small aquariums. She set up four identical 2.0 L tanks, each filled with 1.5 L of the same pond water and the same initial algae sample. She added fertilizer at 0 g, 0.5 g, 1.0 g, or 1.5 g per tank. All tanks were kept under the same lamp, at the same distance from the light, and at 24°C. After 7 days, she measured algae growth by filtering each tank and recording the dry mass of algae (g). The experimenter manipulated which factor and measured which factor?
- Manipulated pond water volume; measured tank size
- Manipulated fertilizer amount; measured algae dry mass (correct answer)
- Manipulated temperature; measured light distance
- Manipulated algae dry mass; measured fertilizer amount
Explanation: In this experiment, the independent variable is the fertilizer amount (0 g, 0.5 g, 1.0 g, or 1.5 g), the dependent variable is the algae dry mass after 7 days, and controlled variables include the tank size (2.0 L), pond water volume (1.5 L), initial algae sample, temperature (24°C), light distance, and lamp used. The independent variable is manipulated to observe its effects, the dependent variable is measured to quantify the response, and controlled variables are held constant to ensure the results stem solely from the manipulation. Choice B correctly identifies that the experimenter manipulated the fertilizer amount and measured the algae dry mass, matching the experimental design. Choice D is a key distractor as it reverses the variables, incorrectly stating algae mass was manipulated and fertilizer measured.
Question 7
A chemist studied how stirring speed affects the time required for 5.0 g of sugar to dissolve in 100 mL of water. She used a magnetic stir plate and tested four stirring speeds: 0 rpm, 200 rpm, 400 rpm, and 600 rpm. The water temperature was kept constant at 25°C using a water bath, and the same beaker type and sugar brand were used each time. For each trial, the chemist started a stopwatch when sugar was added and stopped it when no visible crystals remained. Which of the following is the independent variable?
- Water temperature (25°C)
- Mass of sugar added
- Stirring speed (rpm) (correct answer)
- Time for the sugar to dissolve
Explanation: In this experiment, the independent variable is the stirring speed (0 rpm, 200 rpm, 400 rpm, and 600 rpm), the dependent variable is the time for the sugar to dissolve, and controlled variables include the mass of sugar (5.0 g), water volume (100 mL), water temperature (25°C), beaker type, and sugar brand. The independent variable is the factor the experimenter changes on purpose, the dependent variable is what is observed and recorded as the result, and controlled variables are maintained the same in all trials to prevent them from affecting the outcome. Choice C correctly identifies stirring speed as the independent variable because it was deliberately varied to study its effect on dissolution time. Choice A is a distractor as it represents a controlled variable, the water temperature kept at 25°C, not the manipulated factor.
Question 8
A food science student tested how baking temperature affects cookie spread. She prepared one batch of dough and used a scoop to place identical 30 g dough balls on the same type of baking sheet lined with parchment. She baked trays at 160°C, 180°C, 200°C, and 220°C for exactly 10 minutes in the same oven, allowing the oven to preheat fully each time. After cooling for 5 minutes, she measured cookie diameter (cm) with a ruler. Which variable was held constant?
- Amount of cookie spread
- Baking temperature
- Mass of each dough ball (30 g) (correct answer)
- Cookie diameter after cooling
Explanation: In this experiment, the independent variable is the baking temperature (160°C, 180°C, 200°C, 220°C), the dependent variable is the cookie diameter after cooling (or amount of spread), and controlled variables include the mass of each dough ball (30 g), baking time (10 minutes), dough batch, baking sheet type, parchment lining, oven, and cooling time (5 minutes). The independent variable is altered by the experimenter, the dependent variable is measured to see the resulting change, and controlled variables are kept the same across trials to attribute differences solely to the independent variable. Choice C correctly identifies the mass of each dough ball as a variable held constant because it was fixed at 30 g for all cookies to isolate temperature's effect. Choice D is a distractor as it represents the dependent variable, the measured diameter, which varied rather than being controlled.
Question 9
A chemistry student examined whether stirring rate changes how quickly sugar dissolves. She added 10.0 g of granulated sugar to 200 mL of water at 25∘C in identical beakers. Using the same magnetic stirrer, she tested four stirring settings: 0 rpm (no stirring), 200 rpm, 400 rpm, and 600 rpm. She recorded the time (in seconds) until no visible sugar crystals remained. The sugar mass, water volume, water temperature, beaker type, and observation method were kept the same each trial. The experimenter manipulated and measured .
- water temperature; stirring rate
- stirring rate; time to dissolve (correct answer)
- time to dissolve; sugar mass
- beaker type; water volume
Explanation: In this experiment, the independent variable is the stirring rate, the dependent variable is the time to dissolve, and controlled variables include water temperature, sugar mass, water volume, and beaker type. The independent variable is deliberately varied by the experimenter, the dependent variable is the response that is measured, and controlled variables are maintained constant to ensure the test focuses only on the independent variable's effect. Choice B correctly identifies that the experimenter manipulated the stirring rate (0, 200, 400, 600 rpm) and measured the time to dissolve, matching the roles of independent and dependent variables. Choice A incorrectly swaps the roles, as water temperature was controlled, not manipulated.
Question 10
A student tested the hypothesis that increasing salt concentration lowers the freezing point of water. She prepared four 100 mL samples of distilled water in identical cups and added NaCl to make solutions of 0%, 2%, 4%, and 6% (by mass). Each cup contained a thermometer, and all cups were placed in the same freezer set to −15∘C. The student stirred each sample for 10 s every minute and recorded the temperature at which the first ice crystals appeared (freezing point). The cup type, water volume, freezer setting, and stirring schedule were kept the same for all trials. Which of the following is the independent variable?
- Time spent stirring each minute
- Temperature when ice first appears
- Salt concentration in the water (correct answer)
- Freezer temperature setting
Explanation: In this experiment, the independent variable is the salt concentration in the water, the dependent variable is the temperature when ice first appears, and controlled variables include the freezer temperature setting, water volume, cup type, and stirring schedule. The independent variable is what the experimenter deliberately changes to test its effect, the dependent variable is the outcome measured in response to that change, and controlled variables are factors kept constant to ensure a fair test. Choice C correctly identifies the salt concentration as the independent variable because it was manipulated across different levels (0%, 2%, 4%, 6%) while observing the freezing point. Choice B represents the dependent variable, as it was the measured response, not what was changed.
Question 11
A physics student tested how ramp angle affects the distance a toy car travels after leaving the ramp. The student built a ramp with an adjustable angle and tested angles of 10°, 20°, 30°, and 40°. The car was released from rest from the same marked starting point on the ramp each time. The ramp surface, car, and floor surface were kept the same for all trials. After the car rolled down and left the ramp, the student measured the horizontal distance from the end of the ramp to where the car first stopped. Which factor was controlled in this experiment?
- Ramp angle
- Horizontal stopping distance
- Starting position on the ramp (correct answer)
- Distance from ramp end to stop point
Explanation: In this experiment, the independent variable is the ramp angle (10°, 20°, 30°, and 40°), the dependent variable is the horizontal stopping distance, and controlled variables include the starting position on the ramp, the ramp surface, the toy car, the floor surface, and the release from rest. The independent variable is adjusted by the experimenter to examine its influence, the dependent variable is the measured result of that adjustment, and controlled variables are kept unchanged to ensure the experiment tests only the intended factor. Choice C correctly identifies the starting position as a controlled variable because it was kept the same for all trials to isolate the effect of ramp angle. Choice B is a distractor as it represents the dependent variable, the measured distance, which varied rather than being controlled.
Question 12
A student tested how ramp angle affects the speed of a toy car. She built a ramp of fixed length (1.0 m) and released the same car from rest at the top. She tested four ramp angles: 10∘, 20∘, 30∘, and 40∘. For each angle, she measured the time for the car to travel from the top to the bottom using the same stopwatch and the same start/finish marks. The ramp surface, car, release position, and travel distance were kept constant. Which of the following is the independent variable?
- Toy car model used
- Ramp angle (correct answer)
- Ramp length
- Time for the car to reach the bottom
Explanation: In this experiment, the independent variable is the ramp angle, the dependent variable is the time for the car to reach the bottom, and controlled variables include the ramp length, toy car model, ramp surface, and travel distance. The independent variable is what the researcher changes on purpose, the dependent variable is the observed and measured outcome, and controlled variables are kept the same to prevent them from influencing the results. Choice B correctly identifies the ramp angle as the independent variable because it was adjusted to different degrees (10°, 20°, 30°, 40°) to test its effect on travel time. Choice D is the dependent variable, as it was measured in response to the angle changes, not manipulated.
Question 13
A student studied how surface type affects how far a coin slides. She pushed the same coin with a spring-loaded device set to the same notch each time so the initial push was consistent. She tested four surfaces placed on a level table: glass, wood, sandpaper, and felt. She measured the sliding distance (cm) from the release point until the coin stopped. The coin, push setting, table level, and measurement method were held constant. Which of the following is the independent variable?
- Amount of push from the device
- Type of surface the coin slides on (correct answer)
- Coin mass
- Sliding distance of the coin
Explanation: In this experiment, the independent variable is the type of surface the coin slides on, the dependent variable is the sliding distance of the coin, and controlled variables include the coin mass, amount of push from the device, table level, and measurement method. The independent variable is what the experimenter alters to examine its effect, the dependent variable is the resulting measurement, and controlled variables are maintained constant for consistency across trials. Choice B correctly identifies the type of surface as the independent variable because it was varied (glass, wood, sandpaper, felt) to test its influence on sliding distance. Choice D is the dependent variable, as sliding distance was measured in response to surface changes, not manipulated.
Question 14
A student tested the hypothesis that fertilizer amount affects bean plant growth. She planted one bean seed per pot in identical pots containing the same mass of potting soil. Each pot received one of four fertilizer amounts mixed into the soil: 0 g, 2 g, 4 g, or 6 g. All pots were placed on the same windowsill and rotated daily. Each pot received 50 mL of water every day at the same time. After 21 days, the student measured plant height (cm) from soil surface to the top leaf. Which factor was controlled in this experiment?
- Number of days grown
- Plant height after 21 days
- Daily water volume per pot (correct answer)
- Amount of fertilizer added
Explanation: In this experiment, the independent variable is the amount of fertilizer added, the dependent variable is the plant height after 21 days, and controlled variables include the daily water volume per pot, number of days grown, pot type, soil mass, and location. The independent variable is changed intentionally to study its influence, the dependent variable is the measured effect, and controlled variables are kept unchanged to avoid confounding the results. Choice C correctly identifies the daily water volume as a controlled variable because it was held constant at 50 mL per day for all pots to isolate the fertilizer's effect. Choice D is the independent variable, as fertilizer amounts were varied (0 g, 2 g, 4 g, 6 g), not controlled.
Question 15
A student studied how the length of a pendulum affects its period. She used the same metal bob and the same string type, but adjusted the pendulum length to 20 cm, 40 cm, 60 cm, and 80 cm (measured from pivot to bob center). For each length, she displaced the bob by the same small angle and measured the time for 10 swings, then calculated the period (s). The room conditions were unchanged. In this experiment, the dependent variable is:
- Displacement angle at release
- Period of the pendulum (s) (correct answer)
- Mass of the metal bob
- Pendulum length from pivot to bob
Explanation: The independent variable is pendulum length from pivot to bob (what's being systematically changed), the dependent variable is period of the pendulum in seconds (what's being measured), and controlled variables include bob mass, string type, displacement angle, and room conditions (kept constant). The experiment tests four different lengths (20, 40, 60, 80 cm) to determine their effect on oscillation period. Choice B correctly identifies period as the dependent variable since this is what's calculated from timing measurements in response to length changes. Pendulum length (Choice D) is actually the independent variable being deliberately manipulated.
Question 16
A biology student tested how salinity affects brine shrimp survival. She prepared four tanks with salinities of 0 ppt, 10 ppt, 20 ppt, and 30 ppt using the same brand of salt and the same total water volume. Each tank received 25 shrimp of similar size. All tanks were kept under the same light cycle and at 24∘C. After 48 hours, she counted the number of living shrimp. Which of the following is the independent variable?
- Number of shrimp placed in each tank
- Water temperature (24∘C)
- Salinity of the tank water (ppt) (correct answer)
- Number of living shrimp after 48 hours
Explanation: The independent variable is salinity of the tank water in ppt (what's being systematically changed), the dependent variable is number of living shrimp after 48 hours (what's being measured), and controlled variables include water temperature, light cycle, total water volume, and number of shrimp per tank (kept constant). The experiment tests four different salinities (0, 10, 20, 30 ppt) to determine their effect on shrimp survival. Choice C correctly identifies salinity as the independent variable since this is what the student deliberately manipulated. The number of living shrimp (Choice D) is actually the dependent variable being measured as a response.
Question 17
Researchers tested whether light color affects basil growth. Basil seedlings of the same age were placed in identical pots with the same soil mass and watered with 50 mL daily. Pots were kept in the same growth chamber at 22∘C. Four groups received LED light for 12 hours/day, but the LEDs differed by color: red, blue, green, or white. After 21 days, the researchers measured the height of each plant in centimeters. In this experiment, the dependent variable is:
- Color of LED light used
- Daily watering volume
- Growth-chamber temperature
- Plant height after 21 days (correct answer)
Explanation: The independent variable is color of LED light (what's being manipulated), the dependent variable is plant height after 21 days (what's being measured), and controlled variables include growth chamber temperature, watering volume, pot conditions, and light duration (kept constant). The researchers are testing how different light colors affect plant growth by measuring the final height. Choice D correctly identifies plant height as the dependent variable since this is what responds to and is measured in response to the light color changes. Light color (Choice A) is actually the independent variable being manipulated.
Question 18
A student tested whether the number of paper clips affects how far a rubber band launches a small paper ball. The same rubber band was stretched to the same length each time using a marked ruler line. The student attached 0, 2, 4, or 6 paper clips to the paper ball before launching it from the same height. The distance traveled along the floor was measured in centimeters with a tape measure. The room floor type and launch angle were kept the same. In this experiment, the dependent variable is:
- Number of paper clips attached
- Stretch length of the rubber band
- Distance the paper ball traveled (correct answer)
- Type of floor surface
Explanation: The independent variable is number of paper clips attached (what's being changed), the dependent variable is distance the paper ball traveled (what's being measured), and controlled variables include rubber band stretch length, launch height, floor surface, and launch angle (kept constant). The experiment tests different numbers of paper clips (0, 2, 4, 6) to see their effect on launch distance. Choice C correctly identifies distance traveled as the dependent variable since this is what responds to and is measured in response to the changing number of paper clips. The number of paper clips (Choice A) is actually the independent variable being manipulated.
Question 19
A student investigated how stirring speed affects how quickly sugar dissolves in water. She added 10.0 g of sugar to 200 mL of water in identical beakers. A magnetic stirrer was set to 0 rpm, 200 rpm, 400 rpm, or 600 rpm. Water temperature was kept at 25∘C and the same sugar brand was used. The student measured the time (s) until no visible crystals remained. To isolate the effect of stirring speed, the experimenter controlled:
- Rate of dissolving observed
- Stirring speed in rpm
- Water temperature at 25∘C (correct answer)
- Time until crystals disappeared
Explanation: The independent variable is stirring speed in rpm (what's being changed), the dependent variable is time until crystals disappeared (what's being measured), and controlled variables include water temperature, sugar mass, water volume, beaker type, and sugar brand (kept constant). The experiment tests four different stirring speeds (0, 200, 400, 600 rpm) while maintaining identical conditions otherwise. Choice C correctly identifies water temperature at 25°C as a controlled variable since this was deliberately kept constant to isolate the effect of stirring speed. Stirring speed (Choice B) is actually the independent variable being manipulated.
Question 20
A study examined how the thickness of insulation affects heat loss from a building. Insulation thickness was varied, while the building's size and external temperature were kept constant. Heat loss was measured over a fixed period. The experimenter manipulated [blank] and measured [blank].
- Insulation thickness; Heat loss (correct answer)
- Building size; Heat loss
- External temperature; Insulation thickness
- Heat loss; Building size
Explanation: The independent variable is insulation thickness (what was varied), the dependent variable is heat loss (what was measured over a fixed period), and controlled variables include building size and external temperature (kept constant). The independent variable is what researchers systematically change, while the dependent variable is the outcome they measure in response. Choice A correctly identifies that researchers manipulated insulation thickness and measured heat loss. The other choices incorrectly pair variables or identify controlled variables as manipulated ones.