What this deck covers
This deck focuses on Supply, giving you a quick way to review the definitions, rules, and examples that matter most for AP Macroeconomics.
Study Supply in AP Macroeconomics with focused flashcards that help you recognize the idea, recall the key rule, and apply it in practice-style prompts.
0% Complete
What does an upward movement along the supply curve represent?
Tap card or press Space to flip
Increase in quantity supplied due to a price increase. Movement along curve shows price-quantity relationship.
How well did you know it?
Card 1 / 78
Space to flip · ← / → to move · once flipped, → Got it · ← Still learning
This deck focuses on Supply, giving you a quick way to review the definitions, rules, and examples that matter most for AP Macroeconomics.
Work through these flashcards in short sessions. Try to answer each prompt before flipping the card, then revisit any cards you miss until the explanation feels automatic.
Answer: Increase in quantity supplied due to a price increase. Movement along curve shows price-quantity relationship.
Answer: Changes in production costs, technology, or number of sellers. Non-price factors that affect producers' willingness to supply.
Answer: Supply increases. More sellers add to total market supply.
Answer: Increase in supply. Rightward movement shows more quantity supplied at each price.
Answer: Price where quantity supplied equals quantity demanded. Market clearing price where supply and demand balance.
Answer: Supply decreases. Quotas legally limit maximum quantity that can be supplied.
Answer: Change in price of the good itself. Price changes cause movement along, not shifts of, the curve.
Answer: Supply decreases. Higher input costs raise production expenses, reducing supply.
Answer: Leftward shift. Taxes increase production costs, shifting supply left.
Answer: A graph showing quantity supplied at each price. Visual representation of the price-quantity supplied relationship.
Answer: As price increases, quantity supplied increases. This describes the positive relationship between price and quantity supplied.
Answer: Supply increases. Technology reduces costs, enabling greater supply.
Answer: Supply decreases. Disasters disrupt production, reducing available supply.
Answer: As price increases, quantity supplied increases. This describes the positive relationship between price and quantity supplied.
Answer: Supply increases. Lower costs enable producers to supply more.
Answer: Supply decreases. Higher wages increase production costs, reducing supply.
Answer: Supply curve shifts left. Regulations increase costs, reducing supply at each price.
Answer: Supply decreases. Disasters disrupt production, reducing available supply.
Answer: Current supply decreases. Producers hold back current supply to sell later at higher prices.
Answer: Supply increases. Lower costs enable producers to supply more.
Answer: Technology. Non-price factor that can shift the supply curve.
Answer: Income. Income affects demand, not supply of goods.
Answer: Es=%ΔP%ΔQs. Measures responsiveness of quantity supplied to price changes.
Answer: Difference between market price and minimum price producers accept. Area above supply curve and below market price.
Answer: Upward sloping from left to right. Reflects the positive relationship between price and quantity supplied.
Answer: Increase in quantity supplied due to a price increase. Movement along curve shows price-quantity relationship.
Answer: Decrease in supply. Leftward movement shows less quantity supplied at each price.
Answer: Supply increases. More sellers add to total market supply.
Answer: Supply decreases. Fewer producers means less total market supply.
Answer: Supply increases. Innovation reduces costs, enabling increased production.
Answer: Supply curve shifts left. Regulations increase costs, reducing supply at each price.
Answer: The cost of producing one additional unit of output. The additional expense of producing one more unit.
Answer: Supply decreases. Quotas legally limit maximum quantity that can be supplied.
Answer: Supply curve shifts right. Higher productivity lowers per-unit costs, increasing supply.
Answer: Supply decreases. Taxes increase production costs, discouraging supply.
Answer: Leftward shift. Taxes increase production costs, shifting supply left.
Answer: The cost of producing one additional unit of output. The additional expense of producing one more unit.
Answer: Price where quantity supplied equals quantity demanded. Market clearing price where supply and demand balance.
Answer: Vertical line. Zero elasticity means supply doesn't respond to price changes.
Answer: Supply increases. Technology reduces costs, enabling greater supply.
Answer: Leftward. Removing subsidies increases costs, reducing supply.
Answer: Difference between market price and minimum price producers accept. Area above supply curve and below market price.
Answer: The total quantity supplied by all producers at each price. Sum of individual producer supplies at each price level.
Answer: Vertical line. Zero elasticity means supply doesn't respond to price changes.
Answer: A graph showing quantity supplied at each price. Visual representation of the price-quantity supplied relationship.
Answer: Supply decreases. Fewer producers means less total market supply.
Answer: Horizontal line. Infinite elasticity means any price change causes infinite supply response.
Answer: Supply decreases. Taxes increase production costs, discouraging supply.
Answer: Supply decreases. Below-equilibrium ceiling reduces incentive to supply.
Answer: Costs that change with the level of output. Expenses that vary directly with production level.
Answer: Supply decreases. Higher input costs raise production expenses, reducing supply.
Answer: Es=%ΔP%ΔQs. Measures responsiveness of quantity supplied to price changes.
Answer: Changes in production costs, technology, or number of sellers. Non-price factors that affect producers' willingness to supply.
Answer: Income. Income affects demand, not supply of goods.
Answer: Upward sloping from left to right. Reflects the positive relationship between price and quantity supplied.
Answer: Advancements that increase supply by reducing costs. Lower costs enable producers to supply more at each price.
Answer: A table showing quantity supplied at different prices. Shows the relationship between price levels and corresponding quantities supplied.
Answer: Supply increases. Innovation reduces costs, enabling increased production.
Answer: Decrease in supply. Leftward movement shows less quantity supplied at each price.
Answer: Quantity supplied exceeds quantity demanded. Excess supply creates downward pressure on price.
Answer: A table showing quantity supplied at different prices. Shows the relationship between price levels and corresponding quantities supplied.
Answer: Quantity supplied exceeds quantity demanded. Excess supply creates downward pressure on price.
Answer: Leftward. Removing subsidies increases costs, reducing supply.
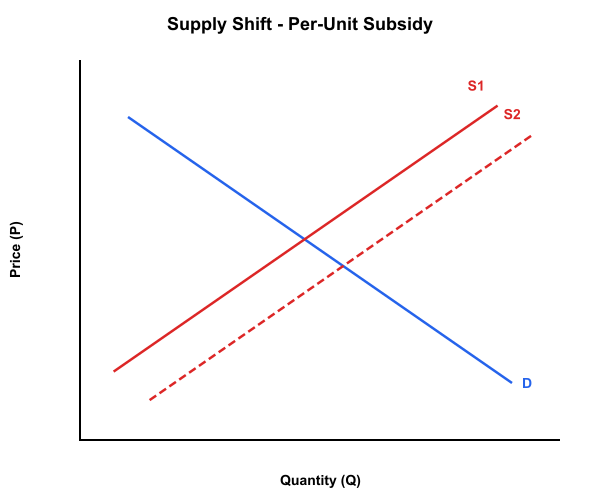
Answer: Supply increases. Subsidies reduce production costs, encouraging more supply.
Answer: Change in price of the good itself. Price changes cause movement along, not shifts of, the curve.
Answer: Decrease in additional output with increased input beyond a point. Explains why supply curves slope upward at higher quantities.
Answer: Current supply decreases. Producers hold back current supply to sell later at higher prices.
Answer: Costs that change with the level of output. Expenses that vary directly with production level.
Answer: Supply increases. Subsidies reduce production costs, encouraging more supply.
Answer: Technology. Non-price factor that can shift the supply curve.
Answer: Decrease in additional output with increased input beyond a point. Explains why supply curves slope upward at higher quantities.
Answer: Supply curve shifts right. Higher productivity lowers per-unit costs, increasing supply.
Answer: Horizontal line. Infinite elasticity means any price change causes infinite supply response.
Answer: Supply decreases. Below-equilibrium ceiling reduces incentive to supply.
Answer: Increase in supply. Rightward movement shows more quantity supplied at each price.
Answer: Supply decreases. Higher wages increase production costs, reducing supply.
Answer: The total quantity supplied by all producers at each price. Sum of individual producer supplies at each price level.