What this deck covers
This deck focuses on Analyze Biodiversity Data, giving you a quick way to review the definitions, rules, and examples that matter most for Biology.
Study Analyze Biodiversity Data in Biology with focused flashcards that help you recognize the idea, recall the key rule, and apply it in practice-style prompts.
0% Complete
What is a confounding variable in a biodiversity field study dataset?
Tap card or press Space to flip
An uncontrolled factor that affects the response and is linked to the predictor. Hidden variable influences both predictor and response.
How well did you know it?
Card 1 / 97
Space to flip · ← / → to move · once flipped, → Got it · ← Still learning
This deck focuses on Analyze Biodiversity Data, giving you a quick way to review the definitions, rules, and examples that matter most for Biology.
Work through these flashcards in short sessions. Try to answer each prompt before flipping the card, then revisit any cards you miss until the explanation feels automatic.
Answer: An uncontrolled factor that affects the response and is linked to the predictor. Hidden variable influences both predictor and response.
Answer: Total diversity across a larger region containing multiple sites. Combined diversity across an entire landscape or region.
Answer: Additional sampling is unlikely to find many new species. Curve flattens when most species are already found.
Answer: It reduces random error and increases confidence in differences observed. Multiple samples distinguish real patterns from chance.
Answer: Diversity increases because individuals are more evenly distributed. More balanced abundance raises diversity measures.
Answer: Environmental quality is likely worsening (for example, pollution increasing). Declining sensitive species suggests habitat degradation.
Answer: Variety of life measured across genetic, species, and ecosystem levels. Includes all forms of life variation across three hierarchical levels.
Answer: Insufficient sampling effort or unequal detectability among species. Undersampling misses rare or hard-to-detect species.
Answer: 0.32. Apply formula: 1−0.68=0.32 for diversity.
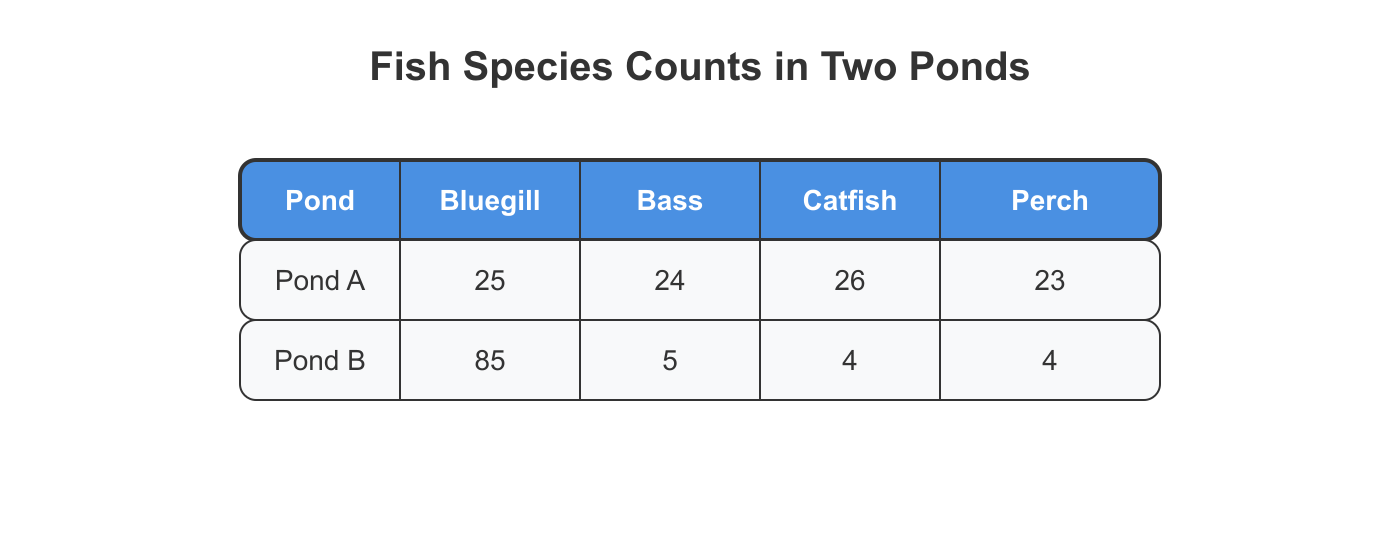
Answer: Community A. Richness is simply the count of species present.
Answer: pi=Nni. Proportion of species i out of total individuals.
Answer: Often reduces native diversity by competition, predation, or disease. Outcompetes natives through various ecological mechanisms.
Answer: Evenness increased. Higher diversity with constant richness means better evenness.
Answer: Higher diversity due to greater richness and or evenness. More species and/or balanced distribution increases index.
Answer: H=−∑piln(pi). Natural log version measuring diversity with evenness weighting.
Answer: Correlation is association; causation means one factor produces the change. Correlation shows pattern; causation proves mechanism.
Answer: An uncontrolled factor that affects the response and is linked to the predictor. Hidden variable influences both predictor and response.
Answer: Changed conditions at habitat edges that can shift species composition. Boundary zones have different conditions affecting species.
Answer: They can differ in evenness despite having the same richness. Evenness affects diversity independently of richness.
Answer: Standardizing diversity comparisons to equal sample size or effort. Corrects for unequal sampling intensity between studies.
Answer: Species richness tends to increase as sampled area increases. Larger areas support more species through habitat diversity.
Answer: Changed conditions at habitat edges that can shift species composition. Boundary zones have different conditions affecting species.
Answer: High beta diversity. Few shared species indicates high species turnover.
Answer: Standardizing diversity comparisons to equal sample size or effort. Corrects for unequal sampling intensity between studies.
Answer: How evenly individuals are distributed among species. Measures how balanced abundance is across species.
Answer: Often reduces native diversity by competition, predation, or disease. Outcompetes natives through various ecological mechanisms.
Answer: The number of different species present in a defined area. Simply counts distinct species without considering abundance.
Answer: Evenness increased. Higher diversity with constant richness means better evenness.
Answer: Whether sampling effort is sufficient to capture most species. Shows if sampling found most species present.
Answer: A species with large ecosystem impact; its loss can reduce diversity. Disproportionate ecological influence maintains community structure.
Answer: H=−∑piln(pi). Natural log version measuring diversity with evenness weighting.
Answer: Diversity within a single site or local community. Local diversity within one habitat or location.
Answer: A species native to and restricted to a specific geographic area. Found only in one specific geographic location.
Answer: Environmental quality is likely worsening (for example, pollution increasing). Declining sensitive species suggests habitat degradation.
Answer: 3 species. Count species with abundance greater than zero.
Answer: Line graph. Displays temporal trends and changes over time.
Answer: Diversity increases because individuals are more evenly distributed. More balanced abundance raises diversity measures.
Answer: The number of different species present in a defined area. Simply counts distinct species without considering abundance.
Answer: Higher diversity due to greater richness and or evenness. More species and/or balanced distribution increases index.
Answer: 0.2. Divide individual count by total sample size.
Answer: Higher diversity with lower dominance by any single species. Higher values indicate more even species distribution.
Answer: Scatter plot. Reveals correlation between two continuous variables.
Answer: 0.5. Subtract the sum of squared proportions from one.
Answer: Total number of individuals of all species in the sample. Sum of all individual organisms across species.
Answer: Total diversity across a larger region containing multiple sites. Combined diversity across an entire landscape or region.
Answer: Breaking habitat into patches, often lowering richness and increasing extinctions. Smaller patches support fewer species due to isolation.
Answer: 0.68. Calculate: (0.8)2+(0.2)2=0.64+0.04.
Answer: Difference in species composition between sites. Measures how species change between different locations.
Answer: Line graph. Displays temporal trends and changes over time.
Answer: 1−∑pi2. Probability-based index measuring species diversity.
Answer: Bar graph. Shows relative abundance differences between categories clearly.
Answer: 1−∑pi2. Probability-based index measuring species diversity.
Answer: 0.5. Subtract the sum of squared proportions from one.
Answer: Additional sampling is unlikely to find many new species. Curve flattens when most species are already found.
Answer: Insufficient sampling effort or unequal detectability among species. Undersampling misses rare or hard-to-detect species.
Answer: Correlation is association; causation means one factor produces the change. Correlation shows pattern; causation proves mechanism.
Answer: Quadrats are representative and placed using an unbiased method. Random placement captures true community diversity patterns.
Answer: %=Nni×100. Converts abundance to percentage of total individuals.
Answer: Difference in species composition between sites. Measures how species change between different locations.
Answer: Accuracy is closeness to true value; precision is consistency of repeats. Accuracy measures correctness; precision measures repeatability.
Answer: Community A. Equal abundances create maximum evenness.
Answer: A pattern where one species has much higher abundance than others. One species overwhelms others in relative abundance.
Answer: Bar graph. Shows relative abundance differences between categories clearly.
Answer: 0.68. Calculate: (0.8)2+(0.2)2=0.64+0.04.
Answer: Breaking habitat into patches, often lowering richness and increasing extinctions. Smaller patches support fewer species due to isolation.
Answer: pi=Nni. Proportion of species i out of total individuals.
Answer: 3 species. Count species with abundance greater than zero.
Answer: A species whose presence or abundance reflects environmental conditions. Abundance changes signal environmental health changes.
Answer: A species native to and restricted to a specific geographic area. Found only in one specific geographic location.
Answer: 0.5. Square each proportion and sum the results.
Answer: Whether sampling effort is sufficient to capture most species. Shows if sampling found most species present.
Answer: High beta diversity. Few shared species indicates high species turnover.
Answer: Accuracy is closeness to true value; precision is consistency of repeats. Accuracy measures correctness; precision measures repeatability.
Answer: Community A. Richness is simply the count of species present.
Answer: 20%. Multiply relative abundance by 100 for percentage.
Answer: Sampling points are consistently spaced and represent the gradient. Systematic sampling accurately reflects environmental changes.
Answer: 0.2. Divide individual count by total sample size.
Answer: %=Nni×100. Converts abundance to percentage of total individuals.
Answer: A species with large ecosystem impact; its loss can reduce diversity. Disproportionate ecological influence maintains community structure.
Answer: Higher diversity with lower dominance by any single species. Higher values indicate more even species distribution.
Answer: The number of individuals of a species in the sample. Raw count of organisms for each species.
Answer: Replacement of species from one site to another. Different species occupy different sites across landscape.
Answer: A pattern where one species has much higher abundance than others. One species overwhelms others in relative abundance.
Answer: 0.5. Square each proportion and sum the results.
Answer: They can differ in evenness despite having the same richness. Evenness affects diversity independently of richness.
Answer: Sampling points are consistently spaced and represent the gradient. Systematic sampling accurately reflects environmental changes.
Answer: 0.32. Apply formula: 1−0.68=0.32 for diversity.
Answer: It reduces random error and increases confidence in differences observed. Multiple samples distinguish real patterns from chance.
Answer: Replacement of species from one site to another. Different species occupy different sites across landscape.
Answer: Community A. Equal abundances create maximum evenness.
Answer: Quadrats are representative and placed using an unbiased method. Random placement captures true community diversity patterns.
Answer: Species richness tends to increase as sampled area increases. Larger areas support more species through habitat diversity.
Answer: The number of individuals of a species in the sample. Raw count of organisms for each species.
Answer: 20%. Multiply relative abundance by 100 for percentage.
Answer: Scatter plot. Reveals correlation between two continuous variables.