What this quiz covers
This quiz focuses on Overlapping Sets, giving you a quick way to practice the rules, question types, and explanations that matter most for GMAT Quantitative.
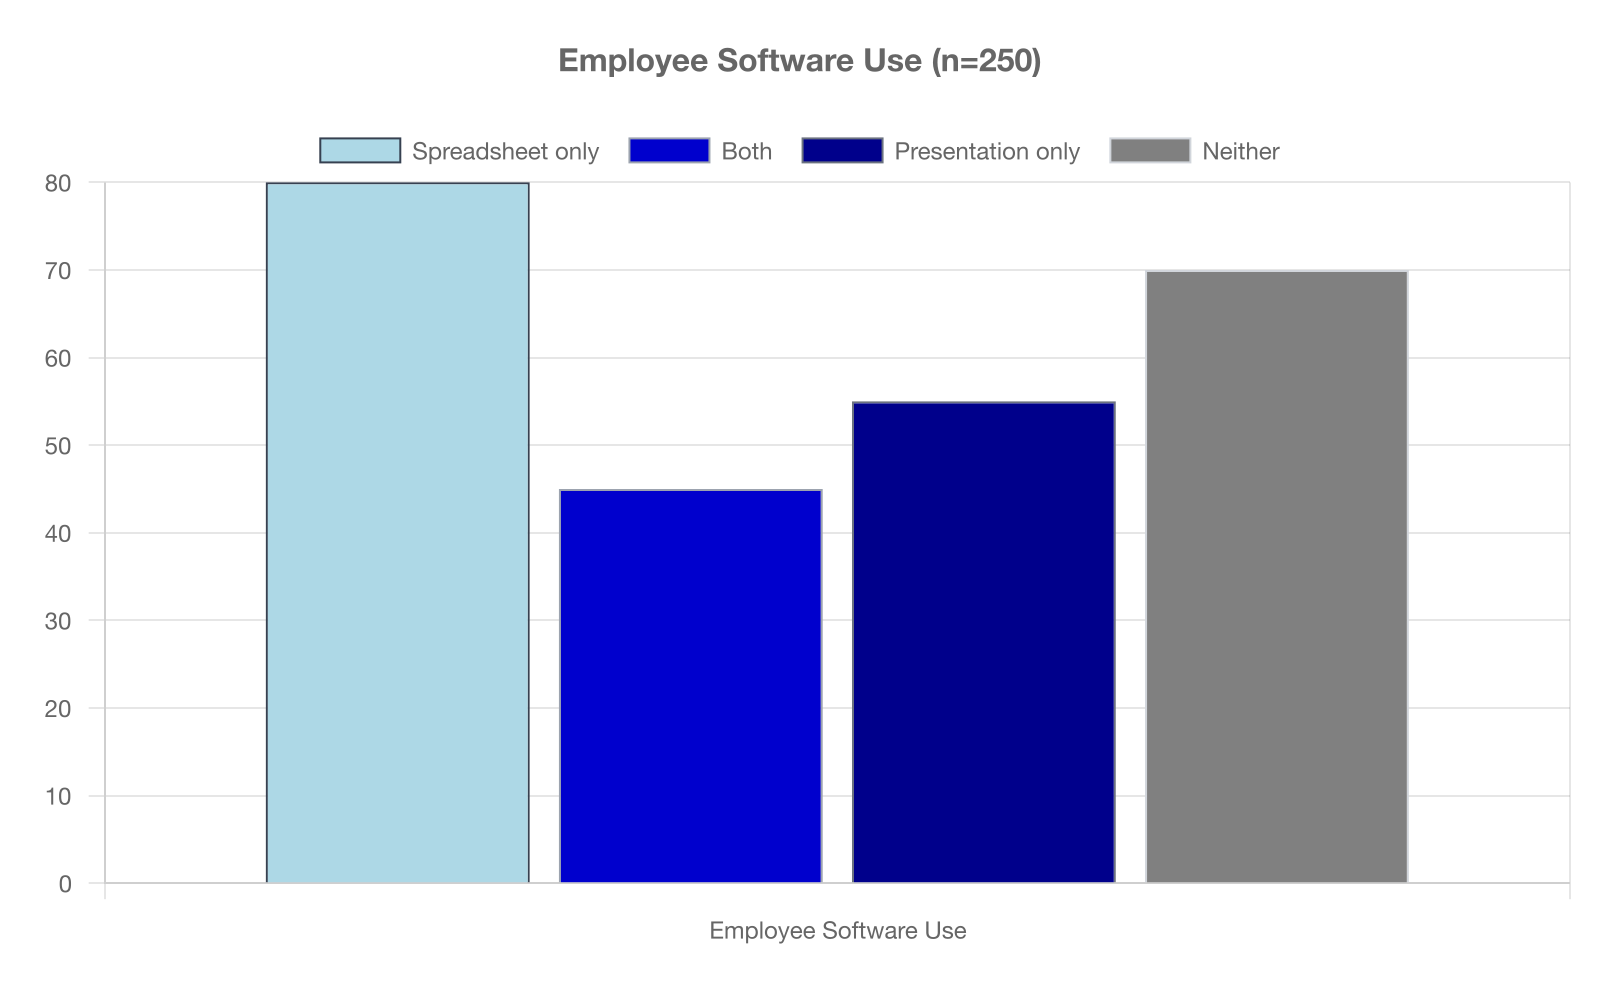
Based on the stacked bar chart, what is the probability that an employee chosen at random from those who use at least one of the two software programs uses both programs?
GMAT Quantitative Quiz
Practice Overlapping Sets in GMAT Quantitative with focused quiz questions that help you check what you know, review explanations, and build confidence with test-style prompts.
This quiz focuses on Overlapping Sets, giving you a quick way to practice the rules, question types, and explanations that matter most for GMAT Quantitative.
Try each quiz question before looking at the correct answer. Use the explanations to review missed ideas, then come back to similar questions until the pattern feels familiar.
Based on the stacked bar chart, what is the probability that an employee chosen at random from those who use at least one of the two software programs uses both programs?
Explanation: The bar shows: Spreadsheet only 80, Presentation only 55, Both 45, Neither 70.
Employees using at least one =80+55+45=180.
Probability of using both =45/180=1/4.
B: 3/11 ≈0.27, would require 49 using both.
C: 9/40 =0.225, would require 40.5 using both.
D: 1/3 =0.333, would require 60 using both.
In a survey of 180 professionals, 120 use laptops, 90 use tablets, and 60 use smartphones. Additionally, 50 use both laptops and tablets, 35 use both laptops and smartphones, and 25 use both tablets and smartphones. If 15 professionals use all three devices, how many professionals use exactly two of these three devices?
Explanation: To find those using exactly two devices, we calculate: (laptops and tablets only) + (laptops and smartphones only) + (tablets and smartphones only). Using the inclusion-exclusion principle: Laptops and tablets only = 50 - 15 = 35; Laptops and smartphones only = 35 - 15 = 20; Tablets and smartphones only = 25 - 15 = 10. Total using exactly two devices = 35 + 20 + 10 = 55. Choice A (45) incorrectly subtracts 15 twice from the sum. Choice C (65) adds 15 instead of subtracting it from each pair. Choice D (75) uses the raw intersection values without accounting for triple overlap.
Among 300 students surveyed about their extracurricular activities, 180 participate in sports, 150 participate in clubs, and 120 participate in volunteer work. The number of students participating in exactly one activity is 150, and 30 students participate in all three activities. How many students participate in exactly two activities?
Explanation: Let the regions be: only one activity = 150, exactly two activities = y, all three = 30. Using inclusion-exclusion and the constraint that all students participate in at least one activity: Total = 150 + y + 30 = 300, so students in multiple activities = 150. Also, |S ∪ C ∪ V| = 180 + 150 + 120 - (sum of pairwise intersections) + 30 = 300. The sum of pairwise intersections includes contributions from exactly two (y) and all three (3 × 30 = 90), so sum = y + 90. Therefore: 450 - (y + 90) + 30 = 300, giving y = 90. Choice A (60) miscounts the triple intersection contribution. Choice B (75) uses incorrect inclusion-exclusion setup. Choice D (105) adds rather than subtracts in the formula.
A company's 200 employees were surveyed about their language skills. The results showed that 140 speak English, 80 speak Spanish, and 60 speak French. Among these, 40 speak both English and Spanish, 30 speak both English and French, and 20 speak both Spanish and French. If the number of employees who speak all three languages is x, what is the maximum possible value of x such that every employee speaks at least one of these languages?
Explanation: Using inclusion-exclusion: |E ∪ S ∪ F| = |E| + |S| + |F| - |E ∩ S| - |E ∩ F| - |S ∩ F| + |E ∩ S ∩ F|. Since all employees speak at least one language, |E ∪ S ∪ F| = 200. Substituting: 200 = 140 + 80 + 60 - 40 - 30 - 20 + x = 190 + x. Therefore, x = 10. Choice B (15) incorrectly assumes we can exceed the constraint of pairwise intersections. Choice C (20) uses the minimum of the pairwise intersections without considering the union constraint. Choice D (25) ignores the inclusion-exclusion formula entirely.
Refer to the diagram. How many of the readers surveyed read exactly one of the three newspapers?
Explanation: Exactly one newspaper means the counts that appear only in a single circle: Financial Times only 15, Wall Street Journal only 12, Economist only 9.
Sum =15+12+9=36.
Choices A, C, and D differ by ±1–3 to look plausible but are incorrect.
Based on the bar graph, what percent of the students who took at least one of the two exams took exactly one of them?
Explanation: The bars give: Science only 28, Both 16, Math only 24.
At least one exam =28+16+24=68.
Exactly one =28+24=52.
Percentage =52/68≈76.5%.
Other choices correspond to treating 48, 50, or 56 students as the numerator—none matches the diagram.
Refer to the pie chart below. Approximately what percent of households own at least one of the two vehicle types?
Explanation: From the pie segments: Car only 65, Bicycle only 25, Both 40, None 20.
At least one vehicle =65+25+40=130 out of 150.
Percentage =130/150=86.7% (rounded to one decimal).
A and B understate by counting only car owners or omitting the overlap; D assumes all but the bicycle-only group.
Refer to the diagram. If exactly 100 students are represented in total, how many belong to all three study groups?
Explanation: Add the six known regions: 18+22+14+9+7+11 = 81.
Let x be the number in all three.
Total =81+x=100⇒x=19.
A, B, and D correspond to subtracting or adding 3 to the correct total and are therefore incorrect.