Statistics & Probability - 6th Grade Math
Card 0 of 628
Find the average of these amounts:
\$34.78, \$21. 69, \$76.89, \$47.88
Find the average of these amounts:
\$34.78, \$21. 69, \$76.89, \$47.88
First, add all the amounts:

Then, divide by 4:

Answer: The average is 45.31
First, add all the amounts:
Then, divide by 4:
Answer: The average is 45.31
Compare your answer with the correct one above
Find the mean in this set of numbers:
210, 120, 110, 220, 120
Find the mean in this set of numbers:
210, 120, 110, 220, 120
First, add up all of the numbers in the set:

Then, divide: 
Answer: The mean is 156.
First, add up all of the numbers in the set:
Then, divide:
Answer: The mean is 156.
Compare your answer with the correct one above
Subtract the mode from the median in this set of numbers:
9080, 9008, 9800, 9099, 9009, 9090, 9008
Subtract the mode from the median in this set of numbers:
9080, 9008, 9800, 9099, 9009, 9090, 9008
First, order the numbers from least to greatest:

Then, find the mode (the most recurring number): 9008
Then, find the median (the middle number): 
Finally, subtract the mode from the median:

Answer: 72.
First, order the numbers from least to greatest:
Then, find the mode (the most recurring number): 9008
Then, find the median (the middle number):
Finally, subtract the mode from the median:
Answer: 72.
Compare your answer with the correct one above
Determine whether or not the following question can be considered as a statistical question.
How many boxes of cookies did each girl sell?
Determine whether or not the following question can be considered as a statistical question.
How many boxes of cookies did each girl sell?
Statistical questions are characterized by possessing inherent variability in the data that is used to answer the question.
In this question, there is variability because each girl will probably sell a different amount of boxes. To answer this question, we would have to find out how many boxes of cookies each girl sold.
Compare your answer with the correct one above
Determine whether or not the following question can be considered as a statistical question.
What is the average test score of a class of  students?
Determine whether or not the following question can be considered as a statistical question.
What is the average test score of a class of
Statistical questions are characterized by possessing inherent variability in the data that is used to answer the question.
In this question, there is variability because each student probably scored differently on the test. To answer this question, we would have to find each student's score and then find the average. Yes
Compare your answer with the correct one above
Determine whether or not the following question can be considered as a statistical question.
How many girls are in your class?
Determine whether or not the following question can be considered as a statistical question.
How many girls are in your class?
Statistical questions are characterized by possessing inherent variability in the data that is used to answer the question.
In this question, there is no variability because there is a set number of girls in a particular class; therefore, it is not a statistical question..
Statistical questions are characterized by possessing inherent variability in the data that is used to answer the question.
In this question, there is no variability because there is a set number of girls in a particular class; therefore, it is not a statistical question..
Compare your answer with the correct one above
Determine whether or not the following question can be considered as a statistical question.
During the school fundraiser, did freshman raise more money than seniors?
Determine whether or not the following question can be considered as a statistical question.
During the school fundraiser, did freshman raise more money than seniors?
Statistical questions are characterized by possessing inherent variability in the data that is used to answer the question.
In this question, there is variability because each student is going to raise a different amount of money. Most likely, some freshman will raise more money than some seniors, and some seniors will raise more than some freshman. To answer this question, we would have to find how much money each student raised and then find the average amount of money raised by freshman and the average amount of money raised by seniors.
Compare your answer with the correct one above
Select the description that best describes the distribution of the data shown in the provided dot plot.
Select the description that best describes the distribution of the data shown in the provided dot plot.
In order to answer this question correctly, we need to define our answer options:
Symmetric: A symmetric distribution will have a middle, or center, and each side from the middle will look fairly similar. Many symmetrical distributions are bell shaped, with the middle being tall, and the two sides thinning out.
Left skewed: A left skewed distribution will have most of the data on the right side of the number line.
Right skewed: A right skewed distribution will have most of the data on the left side of the number line.
The data shown in the number plot has most of the data on the right side; thus, left skewed is the correct answer.
Compare your answer with the correct one above
Select the description that best describes the distribution of the data shown in the provided dot plot.
Select the description that best describes the distribution of the data shown in the provided dot plot.
In order to answer this question correctly, we need to define our answer options:
Symmetric: A symmetric distribution will have a middle, or center, and each side from the middle will look fairly similar. Many symmetrical distributions are bell shaped, with the middle being tall, and the two sides thinning out.
Left skewed: A left skewed distribution will have most of the data on the right side of the number line.
Right skewed: A right skewed distribution will have most of the data on the left side of the number line.
The data shown in the number plot is mostly on the left side; thus, right skewed is the correct answer.
Compare your answer with the correct one above
Select the description that best describes the distribution of the data shown in the provided dot plot.
Select the description that best describes the distribution of the data shown in the provided dot plot.
In order to answer this question correctly, we need to define our answer options:
Symmetric: A symmetric distribution will have a middle, or center, and each side from the middle will look fairly similar. Many symmetrical distributions are bell shaped, with the middle being tall, and the two sides thinning out.
Left skewed: A left skewed distribution will have most of the data on the right side of the number line.
Right skewed: A right skewed distribution will have most of the data on the left side of the number line.
The data shown in the number plot provided has a bell shape look; thus, symmetric is the correct answer.
Compare your answer with the correct one above
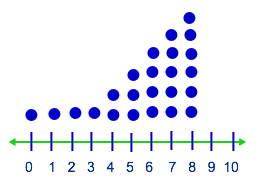
Select the description that best describes the distribution of the data shown in the graph.

Select the description that best describes the distribution of the data shown in the graph.
In order to answer this question correctly, we need to define our answer options:
Symmetric: A symmetric distribution will have a middle, or center, and each side from the middle will look fairly similar. Many symmetrical distributions are bell shaped, with the middle being tall, and the two sides thinning out.
Left skewed: A left skewed distribution will have most of the data on the right side of the number line.
Right skewed: A right skewed distribution will have most of the data on the left side of the number line.
The data shown in the number plot has most of the data on the right side; thus, left skewed is the correct answer.
Compare your answer with the correct one above
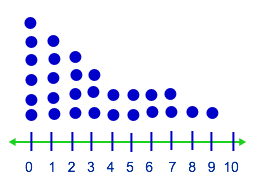
Select the description that best describes the distribution of the data shown in the provided dot plot.
Select the description that best describes the distribution of the data shown in the provided dot plot.
In order to answer this question correctly, we need to define our answer options:
Symmetric: A symmetric distribution will have a middle, or center, and each side from the middle will look fairly similar. Many symmetrical distributions are bell shaped, with the middle being tall, and the two sides thinning out.
Left skewed: A left skewed distribution will have most of the data on the right side of the number line.
Right skewed: A right skewed distribution will have most of the data on the left side of the number line.
The data shown in the number plot is mostly on the left side; thus, right skewed is the correct answer.
Compare your answer with the correct one above
Select the description that best describes the measure of center for a numerical data set.
Select the description that best describes the measure of center for a numerical data set.
By definition, the measure of center for a numerical data set is a value at the center of a data set and summarizes all of the values in a data set with a single number. Algebraically, the most common ways to solve for the measure of center is to solve for the mean or median.
By definition, the measure of center for a numerical data set is a value at the center of a data set and summarizes all of the values in a data set with a single number. Algebraically, the most common ways to solve for the measure of center is to solve for the mean or median.
Compare your answer with the correct one above
Select the description that best describes the measure of variation for a numerical data set.
Select the description that best describes the measure of variation for a numerical data set.
By definition, the measure of variation describes how the data set's values vary with a single number.
By definition, the measure of variation describes how the data set's values vary with a single number.
Compare your answer with the correct one above
Mr. Sommers wanted to see how much money his students spent on school lunch in a given day. The distribution of this data is shown in the plot provided. Use mean to solve for the center of this distribution.
Mr. Sommers wanted to see how much money his students spent on school lunch in a given day. The distribution of this data is shown in the plot provided. Use mean to solve for the center of this distribution.
In order to solve for the mean, we need to add up all of the money spent on lunch, and then divide by the number of addends in our set:


The center of distribution, using the mean, is 
In order to solve for the mean, we need to add up all of the money spent on lunch, and then divide by the number of addends in our set:
The center of distribution, using the mean, is
Compare your answer with the correct one above
Mr. Sommers wanted to see how much money his students spent on school lunch in a given day. The distribution of this data is shown in the plot provided, with each x representing one student in his class. What is the median amount of money that a student spends on lunch?
Mr. Sommers wanted to see how much money his students spent on school lunch in a given day. The distribution of this data is shown in the plot provided, with each x representing one student in his class. What is the median amount of money that a student spends on lunch?
In order to solve for median, we need to list all of our data points in order from least to greatest:

Next, we want to find the number, or numbers that are in the middle:

The center of distribution, using the median, is 
In order to solve for median, we need to list all of our data points in order from least to greatest:
Next, we want to find the number, or numbers that are in the middle:
The center of distribution, using the median, is
Compare your answer with the correct one above
Mr. Sommers wanted to see how much money his students spent on school lunch in a given day. The distribution of this data is shown in the plot provided. What is the highest amount of money spent on lunch by one of Mr. Sommers's students?
Mr. Sommers wanted to see how much money his students spent on school lunch in a given day. The distribution of this data is shown in the plot provided. What is the highest amount of money spent on lunch by one of Mr. Sommers's students?
The plot shows the amount of money spent on school lunch on a number line.  is the greatest number on the number line, and one student spent
  on lunch; thus,
  is the correct answer.
The plot shows the amount of money spent on school lunch on a number line.
Compare your answer with the correct one above
Mr. Sommers wanted to see how much money his students spent on school lunch in a given day. The distribution of this data is shown in the plot provided. What is the least amount of money spent on lunch by one of Mr. Sommers's students?
Mr. Sommers wanted to see how much money his students spent on school lunch in a given day. The distribution of this data is shown in the plot provided. What is the least amount of money spent on lunch by one of Mr. Sommers's students?
The plot shows the amount of money spent on school lunch on a number line.  is the smallest number on the number line, and two students spent
  on lunch; thus,
  is the correct answer.
The plot shows the amount of money spent on school lunch on a number line.
Compare your answer with the correct one above
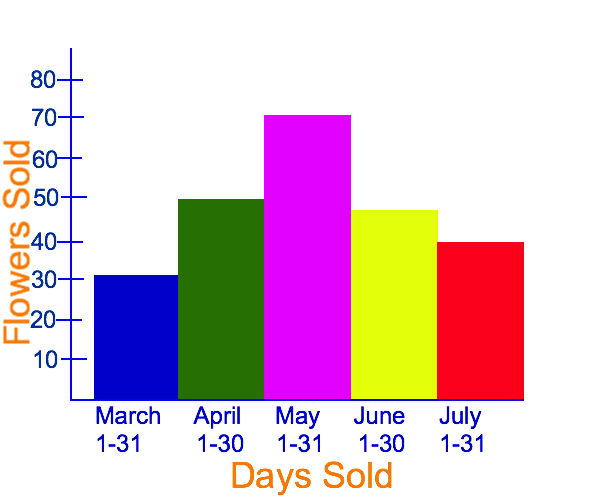
A flower shop counted the number of flowers sold during a  month period. The distribution of this data is show in the histogram provided. Which month were most of the flowers sold in?
A flower shop counted the number of flowers sold during a
To answer this question, we can look at our graph and see how far each bar in the histogram raises:

We can see that in May, the flower shop sold  flowers, which is the most flowers that were sold in a given month.
To answer this question, we can look at our graph and see how far each bar in the histogram raises:
We can see that in May, the flower shop sold
Compare your answer with the correct one above
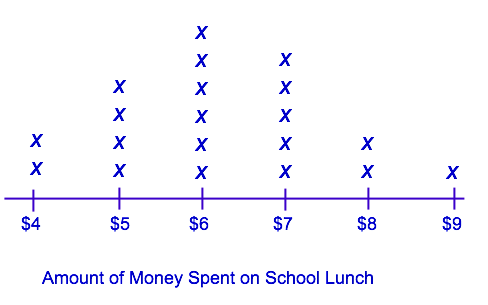
Mr. Sommers wanted to see how much money his students spent on school lunch in a given day. The distribution of this data is shown in the plot provided. Use the information provided in the plot to fill in the blank of the table.
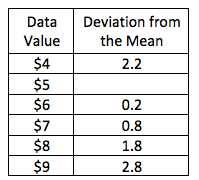
Mr. Sommers wanted to see how much money his students spent on school lunch in a given day. The distribution of this data is shown in the plot provided. Use the information provided in the plot to fill in the blank of the table.
The table shows how far away each data value is from the mean. In order to solve for the missing piece of the table, we first need to solve for the mean:
In order to solve for the mean, we need to add up all of the money spent on lunch, and then divide by the number of addends in our set:


The mean for this data set is 
Next, we can subtract the data value from the mean to find the deviation from the mean:

The correct answer is 
The table shows how far away each data value is from the mean. In order to solve for the missing piece of the table, we first need to solve for the mean:
In order to solve for the mean, we need to add up all of the money spent on lunch, and then divide by the number of addends in our set:
The mean for this data set is
Next, we can subtract the data value from the mean to find the deviation from the mean:
The correct answer is
Compare your answer with the correct one above