How to find data representation in biology - ACT Science
Card 0 of 2176
A researcher studies the olfactory (scent-related) senses of the giant forest ant, Camponotus gigas. The researcher places 120 ants in a three-chambered cell. The cell has an end section with a cotton ball soaked in a saline solution and another end with a cotton ball soaked in a glucose solution. The ants are placed in the middle and timed for 15 minutes. Their initial and final positions in the cell are recorded (see Table 1). The researcher's null hypothesis states that the distribution of ants across the three chambers will be equal to one another. In other words, the glucose solution will have no effect and there will be no significant difference in the distribution of the insects.
Table 1
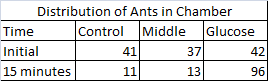
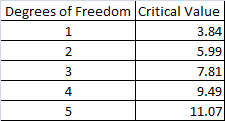
The researcher decides to perform a statistical test known as a Chi-squared test of independence to interpret the experiment's results. The test is performed by calculating a Chi-squared statistic by utilizing observed and expected values for distribution (see Table 2). If the sum of the Chi-squared test statistic is higher than the critical value, then the null hypothesis can be rejected. This indicates that the distribution of insects is not random and the variable in question has a pronounced effect on the subjects. A critical value is calculated by determining the degrees of freedom, which in this experiment is equal to the number of categories in the study minus one, and then locating the proper number on a table (see Table 3). There are three possible categories in this experiment: the glucose end, the control end (with the saline-solution soaked cotton ball), and middle portion of the chamber.
Table 2
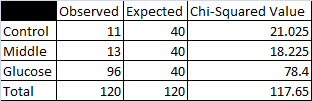
Table 3
What is the critical value of this experiment?
A researcher studies the olfactory (scent-related) senses of the giant forest ant, Camponotus gigas. The researcher places 120 ants in a three-chambered cell. The cell has an end section with a cotton ball soaked in a saline solution and another end with a cotton ball soaked in a glucose solution. The ants are placed in the middle and timed for 15 minutes. Their initial and final positions in the cell are recorded (see Table 1). The researcher's null hypothesis states that the distribution of ants across the three chambers will be equal to one another. In other words, the glucose solution will have no effect and there will be no significant difference in the distribution of the insects.
Table 1
The researcher decides to perform a statistical test known as a Chi-squared test of independence to interpret the experiment's results. The test is performed by calculating a Chi-squared statistic by utilizing observed and expected values for distribution (see Table 2). If the sum of the Chi-squared test statistic is higher than the critical value, then the null hypothesis can be rejected. This indicates that the distribution of insects is not random and the variable in question has a pronounced effect on the subjects. A critical value is calculated by determining the degrees of freedom, which in this experiment is equal to the number of categories in the study minus one, and then locating the proper number on a table (see Table 3). There are three possible categories in this experiment: the glucose end, the control end (with the saline-solution soaked cotton ball), and middle portion of the chamber.
Table 2
Table 3
What is the critical value of this experiment?
Paragraph two states the following: "A critical value is calculated by determining the degrees of freedom, which in this experiment is equal to the number of categories in the study minus one, and then locating the proper number on a table (see Table 3). There are three possible categories in this experiment: the glucose end, the control end (with the saline-solution soaked cotton ball), and middle portion of the chamber."
The degrees of freedom are found by subtracting one from the number of catagories. There are three catagories; therefore, the the degrees of freedom for the statistical test is two.

According to Table 3,  correlates with two degrees of freedom and is the critical value for the study.
Paragraph two states the following: "A critical value is calculated by determining the degrees of freedom, which in this experiment is equal to the number of categories in the study minus one, and then locating the proper number on a table (see Table 3). There are three possible categories in this experiment: the glucose end, the control end (with the saline-solution soaked cotton ball), and middle portion of the chamber."
The degrees of freedom are found by subtracting one from the number of catagories. There are three catagories; therefore, the the degrees of freedom for the statistical test is two.
According to Table 3,
Compare your answer with the correct one above
A researcher studies the olfactory (scent-related) senses of the giant forest ant, Camponotus gigas. The researcher places 120 ants in a three-chambered cell. The cell has an end section with a cotton ball soaked in a saline solution and another end with a cotton ball soaked in a glucose solution. The ants are placed in the middle and timed for 15 minutes. Their initial and final positions in the cell are recorded (see Table 1). The researcher's null hypothesis states that the distribution of ants across the three chambers will be equal to one another. In other words, the glucose solution will have no effect and there will be no significant difference in the distribution of the insects.
Table 1
The researcher decides to perform a statistical test known as a Chi-squared test of independence to interpret the experiment's results. The test is performed by calculating a Chi-squared statistic by utilizing observed and expected values for distribution (see Table 2). If the sum of the Chi-squared test statistic is higher than the critical value, then the null hypothesis can be rejected. This indicates that the distribution of insects is not random and the variable in question has a pronounced effect on the subjects. A critical value is calculated by determining the degrees of freedom, which in this experiment is equal to the number of categories in the study minus one, and then locating the proper number on a table (see Table 3). There are three possible categories in this experiment: the glucose end, the control end (with the saline-solution soaked cotton ball), and middle portion of the chamber.
Table 2
Table 3
If the null hypothesis for this study were supported, what could be said about the ants' distribution?
The null hypothesis describes what results the experiment will yield if the variable being measured makes no difference to the results. This means that the ants should have no difference in their distribution across the cell if the null hypohtesis is supported, since they will not be attracted to the glucose any more than they would be attracted to any other part of the test chamber. If the null hypothesis is supported for this study, then the ants should be distribute themselves equally throughout the chambers.
The null hypothesis describes what results the experiment will yield if the variable being measured makes no difference to the results. This means that the ants should have no difference in their distribution across the cell if the null hypohtesis is supported, since they will not be attracted to the glucose any more than they would be attracted to any other part of the test chamber. If the null hypothesis is supported for this study, then the ants should be distribute themselves equally throughout the chambers.
Compare your answer with the correct one above
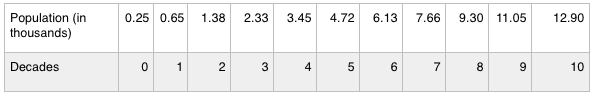
There is a certain species of rabbit that is known to reproduce quickly. 250 of these rabbits were introduced into a new environment, and their population was measured in ten year intervals.
What is the dependent variable in this experiment?
There is a certain species of rabbit that is known to reproduce quickly. 250 of these rabbits were introduced into a new environment, and their population was measured in ten year intervals.
What is the dependent variable in this experiment?
The dependent variable is the "output." In the case of this experiment, the scientists measure the population at regular intervals. The intervals are the independent variable, as they are directly controlled by the scientists and do not depend on the experiment. The population varies depending on the amount fo time that has passed, and cannot be directly controlled by the scientists; thus, population is the dependent variable.
The dependent variable is the "output." In the case of this experiment, the scientists measure the population at regular intervals. The intervals are the independent variable, as they are directly controlled by the scientists and do not depend on the experiment. The population varies depending on the amount fo time that has passed, and cannot be directly controlled by the scientists; thus, population is the dependent variable.
Compare your answer with the correct one above
A group of scientists wanted to test the effects of Nitra-Grow, a chemical additive that can be given to plants to help them grow. 3 test groups of plants were given all the same time of sunlight, the same type of soil, and the same amount of water. Plant A was given no extra chemicals. Plant B was given 5g of Nitra-Grow. Plant C was given 5g of Ammonia to see if Nitra-Grow worked any better than a basic nitrogen-based household product. The plants are then measured on 5 consecutive days to find their average height (in cm).
DAY Height Plant A (cm) Height Plant B (cm) Height Plant C (cm) 1 1.2 1.2 1.2 2 1.4 1.4 1.2 3 1.6 1.8 1.3 4 1.8 2.4 1.3 5 2.0 2.6 1.4
On Day 7, what would be plant A’s approximate height?
A group of scientists wanted to test the effects of Nitra-Grow, a chemical additive that can be given to plants to help them grow. 3 test groups of plants were given all the same time of sunlight, the same type of soil, and the same amount of water. Plant A was given no extra chemicals. Plant B was given 5g of Nitra-Grow. Plant C was given 5g of Ammonia to see if Nitra-Grow worked any better than a basic nitrogen-based household product. The plants are then measured on 5 consecutive days to find their average height (in cm).
| DAY | Height Plant A (cm) | Height Plant B (cm) | Height Plant C (cm) |
|---|---|---|---|
| 1 | 1.2 | 1.2 | 1.2 |
| 2 | 1.4 | 1.4 | 1.2 |
| 3 | 1.6 | 1.8 | 1.3 |
| 4 | 1.8 | 2.4 | 1.3 |
| 5 | 2.0 | 2.6 | 1.4 |
On Day 7, what would be plant A’s approximate height?
The answer is 2.4cm. Every day, plant A increases by a normal rate of 0.2cm per day. Thus adding 0.2 two times to 2.0 will result in 2.4cm.
The answer is 2.4cm. Every day, plant A increases by a normal rate of 0.2cm per day. Thus adding 0.2 two times to 2.0 will result in 2.4cm.
Compare your answer with the correct one above
A group of scientists wanted to test the effects of Nitra-Grow, a chemical additive that can be given to plants to help them grow. 3 test groups of plants were given all the same time of sunlight, the same type of soil, and the same amount of water. Plant A was given no extra chemicals. Plant B was given 5g of Nitra-Grow. Plant C was given 5g of Ammonia to see if Nitra-Grow worked any better than a basic nitrogen-based household product. The plants are then measured on 5 consecutive days to find their average height (in cm).
DAY Height Plant A (cm) Height Plant B (cm) Height Plant C (cm) 1 1.2 1.2 1.2 2 1.4 1.4 1.2 3 1.6 1.8 1.3 4 1.8 2.4 1.3 5 2.0 2.6 1.4
Which plant is the control group?
A group of scientists wanted to test the effects of Nitra-Grow, a chemical additive that can be given to plants to help them grow. 3 test groups of plants were given all the same time of sunlight, the same type of soil, and the same amount of water. Plant A was given no extra chemicals. Plant B was given 5g of Nitra-Grow. Plant C was given 5g of Ammonia to see if Nitra-Grow worked any better than a basic nitrogen-based household product. The plants are then measured on 5 consecutive days to find their average height (in cm).
| DAY | Height Plant A (cm) | Height Plant B (cm) | Height Plant C (cm) |
|---|---|---|---|
| 1 | 1.2 | 1.2 | 1.2 |
| 2 | 1.4 | 1.4 | 1.2 |
| 3 | 1.6 | 1.8 | 1.3 |
| 4 | 1.8 | 2.4 | 1.3 |
| 5 | 2.0 | 2.6 | 1.4 |
Which plant is the control group?
The answer is Plant A. Plant A is getting no extra treatment, whereas Plants B and C are getting added chemicals. (Even though Plant C is being compared as a generic chemical vs. name brand chemical, it is still getting treatment)
The answer is Plant A. Plant A is getting no extra treatment, whereas Plants B and C are getting added chemicals. (Even though Plant C is being compared as a generic chemical vs. name brand chemical, it is still getting treatment)
Compare your answer with the correct one above
Chemotherapy No treatment Surgery and Chemotherapy 2 inches 2 inches 2 inches 2.1 inches 3 inches .05 inches 1.8 inches 5 inches .09 inches 1.4 inches 7 inches .05 inches 1 inch 9 inches .03 inches
The table above shows measurements for tumor size growth over time within three different possible treatment methods. Each tumor was first documented at an initial size of 2 inches. Every month each tumor was measured, for a total of five measurements of each tumor.
Looking at the "Surgery and Chemotherapy" treatment column, where could one infer that chemotherapy was performed?
| Chemotherapy | No treatment | Surgery and Chemotherapy |
|---|---|---|
| 2 inches | 2 inches | 2 inches |
| 2.1 inches | 3 inches | .05 inches |
| 1.8 inches | 5 inches | .09 inches |
| 1.4 inches | 7 inches | .05 inches |
| 1 inch | 9 inches | .03 inches |
The table above shows measurements for tumor size growth over time within three different possible treatment methods. Each tumor was first documented at an initial size of 2 inches. Every month each tumor was measured, for a total of five measurements of each tumor.
Looking at the "Surgery and Chemotherapy" treatment column, where could one infer that chemotherapy was performed?
One would think that surgery as opposed to chemotherapy resulted in a drastic reduction of tumor size; therefore, the smaller reduction of size can be attributed to chemotherapy (0.09 to 0.05).
One would think that surgery as opposed to chemotherapy resulted in a drastic reduction of tumor size; therefore, the smaller reduction of size can be attributed to chemotherapy (0.09 to 0.05).
Compare your answer with the correct one above
Chemotherapy No treatment Surgery and Chemotherapy 2 inches 2 inches 2 inches 2.1 inches 3 inches .05 inches 1.8 inches 5 inches .09 inches 1.4 inches 7 inches .05 inches 1 inch 9 inches .03 inches
The table above shows measurements for tumor size growth over time within three different possible treatment methods. Each tumor was first documented at an initial size of 2 inches. Every month each tumor was measured, for a total of five measurements of each tumor.
Based on the table above, which single method is most effective at reducing tumor size in the shortest period of time?
| Chemotherapy | No treatment | Surgery and Chemotherapy |
|---|---|---|
| 2 inches | 2 inches | 2 inches |
| 2.1 inches | 3 inches | .05 inches |
| 1.8 inches | 5 inches | .09 inches |
| 1.4 inches | 7 inches | .05 inches |
| 1 inch | 9 inches | .03 inches |
The table above shows measurements for tumor size growth over time within three different possible treatment methods. Each tumor was first documented at an initial size of 2 inches. Every month each tumor was measured, for a total of five measurements of each tumor.
Based on the table above, which single method is most effective at reducing tumor size in the shortest period of time?
The tumor size decrease from surgery alone was 2 to 0.05 inches, the largest decrease on the chart. Don't be tricked into answering "Surgery and Chemotherapy" because the questions asks for which single method is most effective.
The tumor size decrease from surgery alone was 2 to 0.05 inches, the largest decrease on the chart. Don't be tricked into answering "Surgery and Chemotherapy" because the questions asks for which single method is most effective.
Compare your answer with the correct one above
Which represents a population that has more than two modes of phenotypic expression?
Which represents a population that has more than two modes of phenotypic expression?

This is the only correct choice. This distribution represents a population that has more than two modes that the populations express. The line indicates no range in the y direction. The hump to the right represents a population that expresses traits on the upper end of the scale. Last, the two-hump line represents a population that possesses two modes of phenotypic expression.
This is the only correct choice. This distribution represents a population that has more than two modes that the populations express. The line indicates no range in the y direction. The hump to the right represents a population that expresses traits on the upper end of the scale. Last, the two-hump line represents a population that possesses two modes of phenotypic expression.
Compare your answer with the correct one above
Chemotherapy No treatment Surgery and Chemotherapy 2 inches 2 inches 2 inches 2.1 inches 3 inches .05 inches 1.8 inches 5 inches .09 inches 1.4 inches 7 inches .05 inches 1 inch 9 inches .03 inches
The table above shows measurements for tumor size growth over time within three different possible treatment methods. Each tumor was first documented at an initial size of 2 inches. Every month each tumor was measured, for a total of five measurements of each tumor.
What information would be most important to know before drawing conclusions based on this data?
| Chemotherapy | No treatment | Surgery and Chemotherapy |
|---|---|---|
| 2 inches | 2 inches | 2 inches |
| 2.1 inches | 3 inches | .05 inches |
| 1.8 inches | 5 inches | .09 inches |
| 1.4 inches | 7 inches | .05 inches |
| 1 inch | 9 inches | .03 inches |
The table above shows measurements for tumor size growth over time within three different possible treatment methods. Each tumor was first documented at an initial size of 2 inches. Every month each tumor was measured, for a total of five measurements of each tumor.
What information would be most important to know before drawing conclusions based on this data?
The key is here the phrase most important. The location and stage of the cancer would play the biggest role in terms of treatment results. All of the other information would be helpful, but the question asks to prioritize which is the most important.
The key is here the phrase most important. The location and stage of the cancer would play the biggest role in terms of treatment results. All of the other information would be helpful, but the question asks to prioritize which is the most important.
Compare your answer with the correct one above
Chemotherapy No treatment Surgery and Chemotherapy 2 inches 2 inches 2 inches 2.1 inches 3 inches .05 inches 1.8 inches 5 inches .09 inches 1.4 inches 7 inches .05 inches 1 inch 9 inches .03 inches
The table above shows measurements for tumor size growth over time within three different possible treatment methods. Each tumor was first documented at an initial size of 2 inches. Every month each tumor was measured, for a total of five measurements of each tumor.
Based on the chart above, what conclusion could be drawn about the "no treatment" option?
| Chemotherapy | No treatment | Surgery and Chemotherapy |
|---|---|---|
| 2 inches | 2 inches | 2 inches |
| 2.1 inches | 3 inches | .05 inches |
| 1.8 inches | 5 inches | .09 inches |
| 1.4 inches | 7 inches | .05 inches |
| 1 inch | 9 inches | .03 inches |
The table above shows measurements for tumor size growth over time within three different possible treatment methods. Each tumor was first documented at an initial size of 2 inches. Every month each tumor was measured, for a total of five measurements of each tumor.
Based on the chart above, what conclusion could be drawn about the "no treatment" option?
Based on the data, the only conclusion that can be drawn is the tumor size increases. One might be tempted to draw the conclusion out further and say that some treatment is always better than no treatment; however, that is a circumstantial conclusion based on the individual patient cases, and cannot be concluded from the data shown.
Based on the data, the only conclusion that can be drawn is the tumor size increases. One might be tempted to draw the conclusion out further and say that some treatment is always better than no treatment; however, that is a circumstantial conclusion based on the individual patient cases, and cannot be concluded from the data shown.
Compare your answer with the correct one above
Chemotherapy No treatment Surgery and Chemotherapy 2 inches 2 inches 2 inches 2.1 inches 3 inches .05 inches 1.8 inches 5 inches .09 inches 1.4 inches 7 inches .05 inches 1 inch 9 inches .03 inches
The table above shows measurements for tumor size growth over time within three different possible treatment methods. Each tumor was first documented at an initial size of 2 inches. Every month each tumor was measured, for a total of five measurements of each tumor.
What conclusion CANNOT be reached based on the data shown above?
| Chemotherapy | No treatment | Surgery and Chemotherapy |
|---|---|---|
| 2 inches | 2 inches | 2 inches |
| 2.1 inches | 3 inches | .05 inches |
| 1.8 inches | 5 inches | .09 inches |
| 1.4 inches | 7 inches | .05 inches |
| 1 inch | 9 inches | .03 inches |
The table above shows measurements for tumor size growth over time within three different possible treatment methods. Each tumor was first documented at an initial size of 2 inches. Every month each tumor was measured, for a total of five measurements of each tumor.
What conclusion CANNOT be reached based on the data shown above?
There is not enough information in the data to know that the cancer cells in all three groups grew at the same rate. Cancer cells can grow at different rates depending on size, stage, and other factors.
There is not enough information in the data to know that the cancer cells in all three groups grew at the same rate. Cancer cells can grow at different rates depending on size, stage, and other factors.
Compare your answer with the correct one above
| | G | g | |
| ---- | -- | -- |
| g | Gg | gg |
| g | Gg | gg |
Scientist’s believe they have found the gene accountable for intelligence. The allele “G” is dominant, and the allele “g” is recessive. The intelligence gene is optimally expressed in the homozygous recessive form. The chart above shows the trait in the heterozygous form and the homozygous form. The form “gg” is from the mother, and “Gg” is from the father. The parents want to know what the gene might look like in their child.
What form of the gene expresses optimal intelligence?
| | G | g | | | ---- | -- | -- | | g | Gg | gg | | g | Gg | gg |
Scientist’s believe they have found the gene accountable for intelligence. The allele “G” is dominant, and the allele “g” is recessive. The intelligence gene is optimally expressed in the homozygous recessive form. The chart above shows the trait in the heterozygous form and the homozygous form. The form “gg” is from the mother, and “Gg” is from the father. The parents want to know what the gene might look like in their child.
What form of the gene expresses optimal intelligence?
The prompt states the intelligence gene is "optimally expressed in the homozygous recessive form." Therefore, this is the "gg" form.
The prompt states the intelligence gene is "optimally expressed in the homozygous recessive form." Therefore, this is the "gg" form.
Compare your answer with the correct one above
| | G | g | |
| ---- | -- | -- |
| g | Gg | gg |
| g | Gg | gg |
Scientist’s believe they have found the gene accountable for intelligence. The allele “G” is dominant, and the allele “g” is recessive. The intelligence gene is optimally expressed in the homozygous recessive form. The chart above shows the trait in the heterozygous form and the homozygous form. The form “gg” is from the mother, and “Gg” is from the father. The parents want to know what the gene might look like in their child.
According to the chart above, what are the chances of the child inheriting the optimal form of the gene?
| | G | g | | | ---- | -- | -- | | g | Gg | gg | | g | Gg | gg |
Scientist’s believe they have found the gene accountable for intelligence. The allele “G” is dominant, and the allele “g” is recessive. The intelligence gene is optimally expressed in the homozygous recessive form. The chart above shows the trait in the heterozygous form and the homozygous form. The form “gg” is from the mother, and “Gg” is from the father. The parents want to know what the gene might look like in their child.
According to the chart above, what are the chances of the child inheriting the optimal form of the gene?
The optimal form of the gene is the homozygous reccesive "gg," which has a 50 percent chance of resulting from the parental cross.
The optimal form of the gene is the homozygous reccesive "gg," which has a 50 percent chance of resulting from the parental cross.
Compare your answer with the correct one above
Amino acids, when strung together in extensive chains, serve as the building blocks of muscles and proteins. At around 37ºC, these amino acid chains allow the body to carry out both macroscopic processes, like moving arms and legs, and microscopic processes, like increasing the rate of chemical reactions. A special class of proteins called enzymes assists in combining reactants to produce products by speeding up the rate of a reaction in one of three ways.
The first way enzymes increase reaction rate is by lowering the activation energy of a reaction. This is done by balancing positively charged amino acids with negatively charged amino acids, creating an electrically neutral environment. This process is called electrostatic interaction. Another way enzymes increase reaction rate is through the use of non-charged amino acids, such as valine and isoleucine, in a process called Van der Waals interactions. In Van der Waals interactions, the non-charged amino acids become temporarily polarized, similar to the permanent polarity of positively and negatively charged amino acids. This interaction brings non-charged amino acids together to stabilize the reactants. The final way enzymes increase reaction rates is by sharing the electrons in its hydrogen atoms with nitrogen, oxygen, or fluorine on the reactant molecules to trap them at the active site. The active site is the part of an enzyme where molecules bind and undergo a chemical reaction.
Enzymes are designed to work in specific parts of the body depending on their functions. For example, an enzyme in the stomach responsible for breaking down food would work most effectively at low pH while an enzyme in the small intestine responsible for absorbing food would work most effectively at high pH. Some enzymes, such as those that function in the blood, work best at intermediate pH. Some enzymes function better at lower temperatures while others require higher temperatures. All enzymes have exponential relationships between their rates of reactions and both pH and temperature, meaning that they function best in narrow pH and temperature windows. Graphs of four enzymes and their rates of reaction at various pH levels and temperature are presented below.


Based on the figures, which enzyme is most likely to function in the small intestine?
Amino acids, when strung together in extensive chains, serve as the building blocks of muscles and proteins. At around 37ºC, these amino acid chains allow the body to carry out both macroscopic processes, like moving arms and legs, and microscopic processes, like increasing the rate of chemical reactions. A special class of proteins called enzymes assists in combining reactants to produce products by speeding up the rate of a reaction in one of three ways.
The first way enzymes increase reaction rate is by lowering the activation energy of a reaction. This is done by balancing positively charged amino acids with negatively charged amino acids, creating an electrically neutral environment. This process is called electrostatic interaction. Another way enzymes increase reaction rate is through the use of non-charged amino acids, such as valine and isoleucine, in a process called Van der Waals interactions. In Van der Waals interactions, the non-charged amino acids become temporarily polarized, similar to the permanent polarity of positively and negatively charged amino acids. This interaction brings non-charged amino acids together to stabilize the reactants. The final way enzymes increase reaction rates is by sharing the electrons in its hydrogen atoms with nitrogen, oxygen, or fluorine on the reactant molecules to trap them at the active site. The active site is the part of an enzyme where molecules bind and undergo a chemical reaction.
Enzymes are designed to work in specific parts of the body depending on their functions. For example, an enzyme in the stomach responsible for breaking down food would work most effectively at low pH while an enzyme in the small intestine responsible for absorbing food would work most effectively at high pH. Some enzymes, such as those that function in the blood, work best at intermediate pH. Some enzymes function better at lower temperatures while others require higher temperatures. All enzymes have exponential relationships between their rates of reactions and both pH and temperature, meaning that they function best in narrow pH and temperature windows. Graphs of four enzymes and their rates of reaction at various pH levels and temperature are presented below.
Based on the figures, which enzyme is most likely to function in the small intestine?
The passage states that enzymes that work in the small intestine function best at high pH. Based on the figure comparing rate of reaction to pH, we see that only the green curve has a high rate of reaction at high pH, indicating that it would function best in the high pH environment of the small intestine.
The passage states that enzymes that work in the small intestine function best at high pH. Based on the figure comparing rate of reaction to pH, we see that only the green curve has a high rate of reaction at high pH, indicating that it would function best in the high pH environment of the small intestine.
Compare your answer with the correct one above
| | G | g | |
| ---- | -- | -- |
| g | Gg | gg |
| g | Gg | gg |
Scientist’s believe they have found the gene accountable for intelligence. The allele “G” is dominant, and the allele “g” is recessive. The intelligence gene is optimally expressed in the homozygous recessive form. The chart above shows the trait in the heterozygous form and the homozygous form. The form “gg” is from the mother, and “Gg” is from the father. The parents want to know what the gene might look like in their child.
According to the data given, what could one infer about the phenotype for "Gg?"
| | G | g | | | ---- | -- | -- | | g | Gg | gg | | g | Gg | gg |
Scientist’s believe they have found the gene accountable for intelligence. The allele “G” is dominant, and the allele “g” is recessive. The intelligence gene is optimally expressed in the homozygous recessive form. The chart above shows the trait in the heterozygous form and the homozygous form. The form “gg” is from the mother, and “Gg” is from the father. The parents want to know what the gene might look like in their child.
According to the data given, what could one infer about the phenotype for "Gg?"
The prompt does not tell what the phenotype of "Gg" is, it just mentions the phenotype for "gg" is optimal intelligence.
The prompt does not tell what the phenotype of "Gg" is, it just mentions the phenotype for "gg" is optimal intelligence.
Compare your answer with the correct one above
| | G | g | |
| ---- | -- | -- |
| g | Gg | gg |
| g | Gg | gg |
Scientist’s believe they have found the gene accountable for intelligence. The allele “G” is dominant, and the allele “g” is recessive. The intelligence gene is optimally expressed in the homozygous recessive form. The chart above shows the trait in the heterozygous form and the homozygous form. The form “gg” is from the mother, and “Gg” is from the father. The parents want to know what the gene might look like in their child.
What genotypes would two parents want to have to increase their chances of a child exhibiting an optimal intelligence phenotype?
| | G | g | | | ---- | -- | -- | | g | Gg | gg | | g | Gg | gg |
Scientist’s believe they have found the gene accountable for intelligence. The allele “G” is dominant, and the allele “g” is recessive. The intelligence gene is optimally expressed in the homozygous recessive form. The chart above shows the trait in the heterozygous form and the homozygous form. The form “gg” is from the mother, and “Gg” is from the father. The parents want to know what the gene might look like in their child.
What genotypes would two parents want to have to increase their chances of a child exhibiting an optimal intelligence phenotype?
Two parents with genotype "gg" would create a 100 percent chance of having a child with the "gg" genotype, which results in the optimal intelligence phenotype.
Two parents with genotype "gg" would create a 100 percent chance of having a child with the "gg" genotype, which results in the optimal intelligence phenotype.
Compare your answer with the correct one above

The chart above shows the height growth of three different plant species after a period of 2 weeks. Each plant species was grown in 4 different soil mediums. All the plants were grown in the same environment with equal amounts of light, water, and oxygen.
What could be added to this experiment to improve the data representation?
All of the options listed would make the data representation better.
All of the options listed would make the data representation better.
Compare your answer with the correct one above
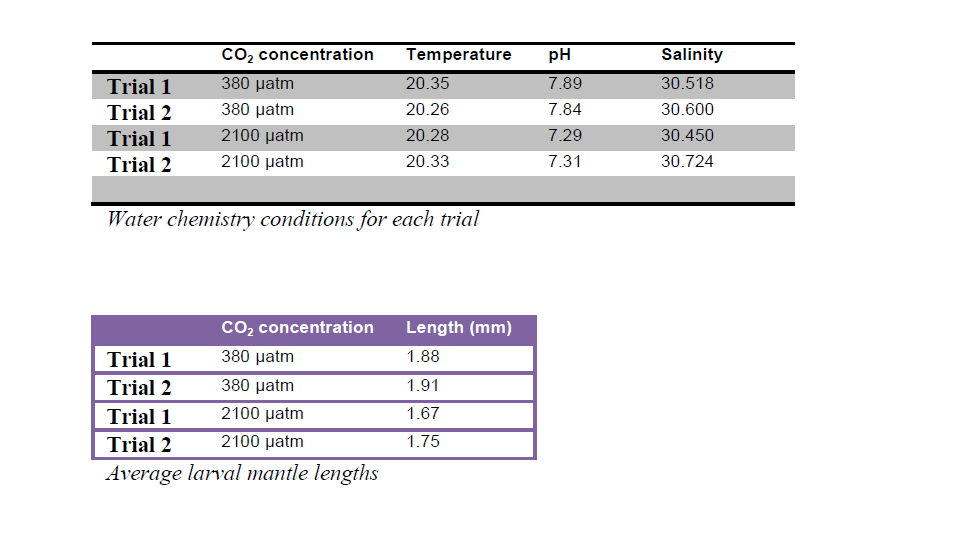
The significant increase in atmospheric carbon dioxide since pre-industrial levels can be seen in the world’s oceans which absorb the CO2 and in turn undergo changes in chemistry. The consequences of increased CO2 include acidification of seawater and a decrease in carbonate ion (CO32-) concentration.
Changes in seawater chemistry affect marine organisms. The early life stages of invertebrates, such as squid, may be particularly vulnerable to changes in carbon dioxide levels. Acting as both predator and prey, squid are a significant component of marine ecosystems. For example, fish and sea birds, such as tuna and albatross, are dependent on squid as a source of prey. Furthermore, the fishing industry is impacted by the health of squid populations. California fisheries produce the majority of market squid.
In order to determine how increased levels of carbon dioxide affect the development of squid, eggs were hatched in two different conditions: normal (380 µatm) and elevated (2100 µatm) levels of CO2. The time to hatch and the size of the larval mantle (the anatomical feature that includes the body wall and fins) were measured and recorded. Two trials were conducted for each carbon dioxide concentration.
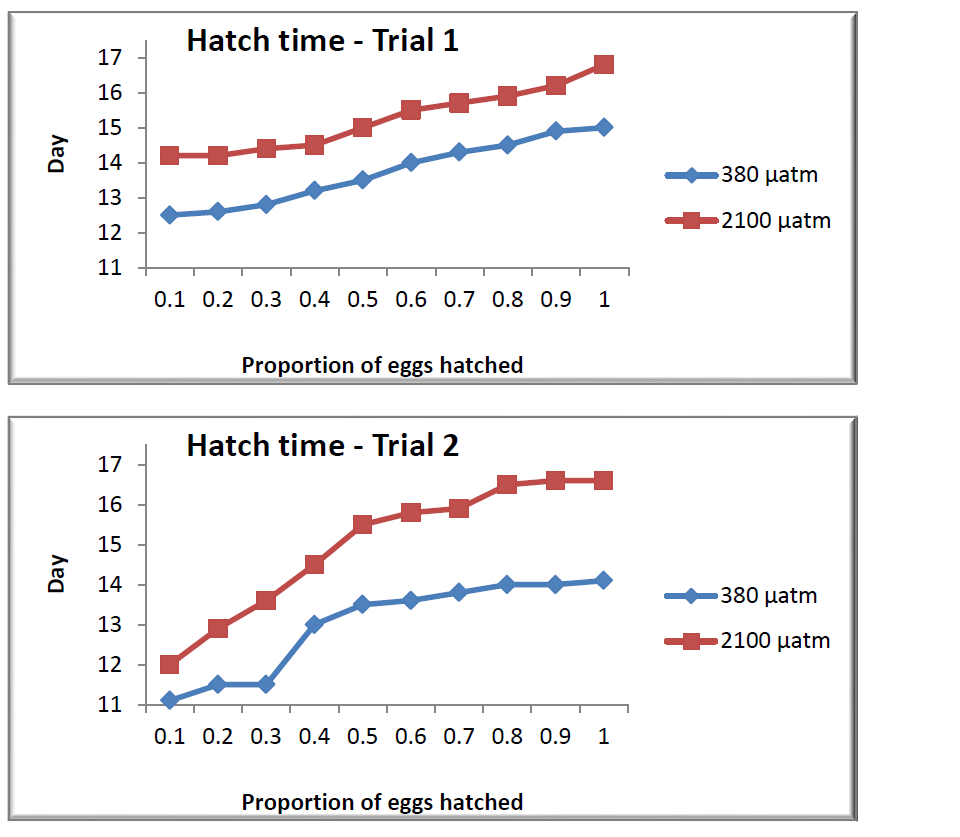
Compared to the hatch time data in Trial 1, _________.
The significant increase in atmospheric carbon dioxide since pre-industrial levels can be seen in the world’s oceans which absorb the CO2 and in turn undergo changes in chemistry. The consequences of increased CO2 include acidification of seawater and a decrease in carbonate ion (CO32-) concentration.
Changes in seawater chemistry affect marine organisms. The early life stages of invertebrates, such as squid, may be particularly vulnerable to changes in carbon dioxide levels. Acting as both predator and prey, squid are a significant component of marine ecosystems. For example, fish and sea birds, such as tuna and albatross, are dependent on squid as a source of prey. Furthermore, the fishing industry is impacted by the health of squid populations. California fisheries produce the majority of market squid.
In order to determine how increased levels of carbon dioxide affect the development of squid, eggs were hatched in two different conditions: normal (380 µatm) and elevated (2100 µatm) levels of CO2. The time to hatch and the size of the larval mantle (the anatomical feature that includes the body wall and fins) were measured and recorded. Two trials were conducted for each carbon dioxide concentration.
Compared to the hatch time data in Trial 1, _________.
Comparing the difference between the curves of normal and elevated carbon dioxide egg hatching data, we see that the lines diverge more so in Trial 2:
Comparing the difference between the curves of normal and elevated carbon dioxide egg hatching data, we see that the lines diverge more so in Trial 2:
Compare your answer with the correct one above
There is a certain species of rabbit that is known to reproduce quickly. 250 of these rabbits were introduced into a new environment, and their population was measured in ten year intervals.
Which of the following is an accurate graphic representation of the data?
There is a certain species of rabbit that is known to reproduce quickly. 250 of these rabbits were introduced into a new environment, and their population was measured in ten year intervals.
Which of the following is an accurate graphic representation of the data?
The correct answer starts at 0.25, since the initial population is greater than zero, and increases correctly with the table of information. Population trends are usually exponential, which also helps us determine our answer.
The correct answer starts at 0.25, since the initial population is greater than zero, and increases correctly with the table of information. Population trends are usually exponential, which also helps us determine our answer.
Compare your answer with the correct one above
The significant increase in atmospheric carbon dioxide since pre-industrial levels can be seen in the world’s oceans which absorb the CO2 and in turn undergo changes in chemistry. The consequences of increased CO2 include acidification of seawater and a decrease in carbonate ion (CO32-) concentration.
Changes in seawater chemistry affect marine organisms. The early life stages of invertebrates, such as squid, may be particularly vulnerable to changes in carbon dioxide levels. Acting as both predator and prey, squid are a significant component of marine ecosystems. For example, fish and sea birds, such as tuna and albatross, are dependent on squid as a source of prey. Furthermore, the fishing industry is impacted by the health of squid populations. California fisheries produce the majority of market squid.
In order to determine how increased levels of carbon dioxide affect the development of squid, eggs were hatched in two different conditions: normal (380 µatm) and elevated (2100 µatm) levels of CO2. The time to hatch and the size of the larval mantle (the anatomical feature that includes the body wall and fins) were measured and recorded. Two trials were conducted for each carbon dioxide concentration.
For water with a carbon dioxide concentration of 380 µatm, when would half of squid eggs be expected to be hatched?
The question asks us to determine when half of the squid eggs would be hatched in the 380 µatm group (blue line). For this question, you can ignore the red lines. On the  -axis, find 0.5 (this corresponds to half of the eggs). Then, find the corresponding number of days on the
  -axis. We find that 0.5 falls between days 13 and 14 for Trials 1 and 2.
The question asks us to determine when half of the squid eggs would be hatched in the 380 µatm group (blue line). For this question, you can ignore the red lines. On the
Compare your answer with the correct one above