Functions and Graphs - Algebra 2
Card 1 of 2484
Give the solution set of the inequality:

Give the solution set of the inequality:
Tap to reveal answer
Rewrite in standard form and factor:


(x+4) <0")
The zeroes of the polynomial are therefore  , so we test one value in each of three intervals
 ") ,
, ") , and
, and ") to determine which ones are included in the solution set.
to determine which ones are included in the solution set.
") :
:
Test  :
:
^{2}$ - 20 < -5")


False; ") is not in the solution set.
is not in the solution set.
") :
:
Test 


True; ") is in the solution set
is in the solution set
") :
:
Test  :
:


False; ") is not in the solution set.
is not in the solution set.
Since the inequality symbol is  , the boundary points are not included. The solution set is the interval
 ") .
.
Rewrite in standard form and factor:
The zeroes of the polynomial are therefore
Test
False;
Test
True;
Test
False;
Since the inequality symbol is
← Didn't Know|Knew It →
Give the set of solutions for this inequality:

Give the set of solutions for this inequality:
Tap to reveal answer
The first step of questions like this is to get the quadratic in its standard form. So we move the  over to the left side of the inequality:

This quadratic can easily be factored as(x+2)") . So now we can write this in the form
. So now we can write this in the form
(x+2) <0")
and look at each of the factors individually. Recall that a negative number times a negative is a positive number. Therefore the boundaries of our solution interval is going to be when both of these factors are negative. ") is negative whenever
is negative whenever  , and
, and ") is negative whenever
is negative whenever  . Since
  , one of our boundaries will be
  . Remember that this will be an open interval since it is less than, not less than or equal to.
Our other boundary will be the other point when the product of the factors becomes positive. Remember that ") is positive when
is positive when  , so our other boundary is
  . So the solution interval we arrive at is
")
The first step of questions like this is to get the quadratic in its standard form. So we move the
This quadratic can easily be factored as
and look at each of the factors individually. Recall that a negative number times a negative is a positive number. Therefore the boundaries of our solution interval is going to be when both of these factors are negative.
Our other boundary will be the other point when the product of the factors becomes positive. Remember that
← Didn't Know|Knew It →
Solve for 

Solve for
Tap to reveal answer
When asked to solve for x we need to isolate x on one side of the equation.
To do this our first step is to subtract 7 from both sides.


From here, we divide by 4 to solve for x.


When asked to solve for x we need to isolate x on one side of the equation.
To do this our first step is to subtract 7 from both sides.
From here, we divide by 4 to solve for x.
← Didn't Know|Knew It →
Solve for 

Solve for
Tap to reveal answer
When asked to solve for y we need to isolate the variable on one side and the constants on the other side.
To do this we first add 9 to both sides.


From here, we divide by -12 to solve for y.


When asked to solve for y we need to isolate the variable on one side and the constants on the other side.
To do this we first add 9 to both sides.
From here, we divide by -12 to solve for y.
← Didn't Know|Knew It →
The graphs of the lines  and
and  are shown on the figure. The region
  is defined by which two inequalities?

The graphs of the lines
Tap to reveal answer
The region  contains only
  values which are greater than or equal to those on the line
  , so its
  values are
  .
.
Similarly, the region contains only  values which are less than or equal to those on the line
  , so its
  values are
  .
.
The region
Similarly, the region contains only
← Didn't Know|Knew It →
The graphs for the lines  and
and  are shown in the figure. The region
  is defined by which two inequalities?

The graphs for the lines
Tap to reveal answer
The region  contains only
  values which are greater than or equal to those on the line
  , so its
  values are
  .
.
Also, the region contains only  values which are less than or equal to those on the line
  , so its
  values are
  .
.
The region
Also, the region contains only
← Didn't Know|Knew It →
Which of the following graphs correctly represents the quadratic inequality below (solutions to the inequalities are shaded in blue)?

Which of the following graphs correctly represents the quadratic inequality below (solutions to the inequalities are shaded in blue)?
Tap to reveal answer
To begin, we analyze the equation given: the base equation,  is shifted left one unit and vertically stretched by a factor of 2. The graph of the equation
  is:
is:

To solve the inequality, we need to take a test point and plug it in to see if it matches the inequality. The only points that cannot be used are those directly on our parabola, so let's use the origin ") . If plugging this point in makes the inequality true, then we shade the area containing that point (in this case, outside the parabola); if it makes the inequality untrue, then the opposite side is shaded (in this case, the inside of the parabola). Plugging the numbers in shows:
. If plugging this point in makes the inequality true, then we shade the area containing that point (in this case, outside the parabola); if it makes the inequality untrue, then the opposite side is shaded (in this case, the inside of the parabola). Plugging the numbers in shows:

Simplified as:

Which is not true, so the area inside of the parabola should be shaded, resulting in the following graph:

To begin, we analyze the equation given: the base equation,
To solve the inequality, we need to take a test point and plug it in to see if it matches the inequality. The only points that cannot be used are those directly on our parabola, so let's use the origin
Simplified as:
Which is not true, so the area inside of the parabola should be shaded, resulting in the following graph:
← Didn't Know|Knew It →
Try without a calculator.
The graph with the following equation is a parabola characterized by which of the following?

Try without a calculator.
The graph with the following equation is a parabola characterized by which of the following?
Tap to reveal answer
The parabola of an equation of the form  is vertical, and faces upward or downward depending entirely on the sign of
  , the coefficient of
  . This coefficient,
  , is negative; the parabola is concave downward.
The parabola of an equation of the form
← Didn't Know|Knew It →
The vertex of the graph of the function
= $-4x^{2}$+ 12x - 9")
appears
The vertex of the graph of the function
appears
Tap to reveal answer
The graph of the quadratic function  = $ax^{2}$ + bx+ c") is a parabola with its vertex at the point with coordinates
is a parabola with its vertex at the point with coordinates
 \right )") .
.
Set  ; the
; the  -coordinate is
}$ = - $\frac{12}{-8}$ = $\frac{3}{2}$ = 1$\frac{1}{2}$")
Evaluate ") by substitution:
by substitution:
= -4 \left ( $\frac{3}{2}$ \right $)^{2}$+ 12 \left ( $\frac{3}{2}$ \right ) - 9")
 + 12 \left ( $\frac{3}{2}$ \right ) - 9")


The vertex has 0 as its  -coordinate; it is therefore on an axis.
The graph of the quadratic function
Set
Evaluate
The vertex has 0 as its
← Didn't Know|Knew It →
Try without a calculator.
The graph of a function with the given equation forms a parabola that is characterized by which of the following?

Try without a calculator.
The graph of a function with the given equation forms a parabola that is characterized by which of the following?
Tap to reveal answer
The graph of an equation of the form

is a horizontal parabola. Whether it is concave to the left or to the right depends on the sign of  . Since
  , a negative number, the parabola is concave to the left.
The graph of an equation of the form
is a horizontal parabola. Whether it is concave to the left or to the right depends on the sign of
← Didn't Know|Knew It →
Which equation best represents the following graph?
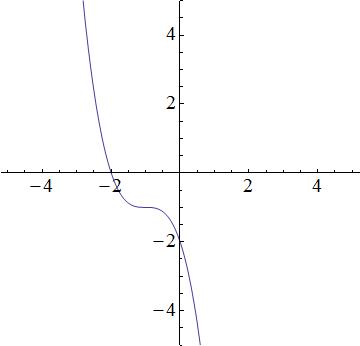
Which equation best represents the following graph?
Tap to reveal answer
We have the following answer choices.
=-(x + $1)^3$ - 1")
=-(x + $1)^2$ - 1")
=-x - 1")
The first equation is a cubic function, which produces a function similar to the graph. The second equation is quadratic and thus, a parabola. The graph does not look like a prabola, so the 2nd equation will be incorrect. The third equation describes a line, but the graph is not linear; the third equation is incorrect. The fourth equation is incorrect because it is an exponential, and the graph is not an exponential. So that leaves the first equation as the best possible choice.
We have the following answer choices.
The first equation is a cubic function, which produces a function similar to the graph. The second equation is quadratic and thus, a parabola. The graph does not look like a prabola, so the 2nd equation will be incorrect. The third equation describes a line, but the graph is not linear; the third equation is incorrect. The fourth equation is incorrect because it is an exponential, and the graph is not an exponential. So that leaves the first equation as the best possible choice.
← Didn't Know|Knew It →
For the graph below, match the graph b with one of the following equations:
")

")
^{2}$")
")
^{2}$")
")
^{2}$ -2")
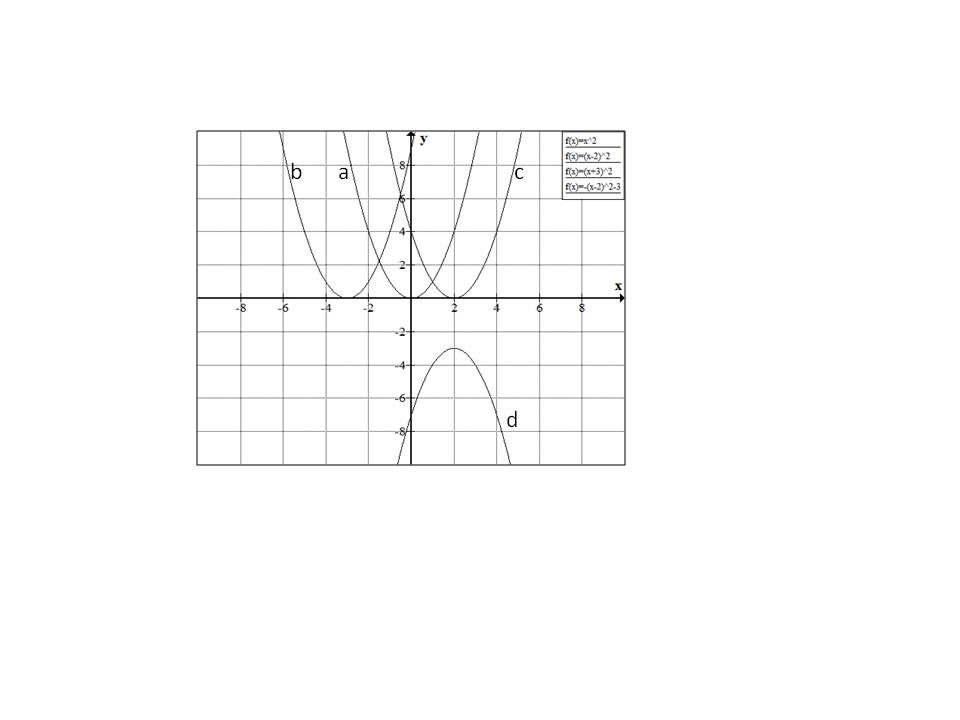
For the graph below, match the graph b with one of the following equations:
Tap to reveal answer
Starting with 
 moves the parabola
  by
by  units to the right.
Similarly  moves the parabola by
  units to the left.
Hence the correct answer is option  .
.
Starting with
Similarly
Hence the correct answer is option
← Didn't Know|Knew It →
Which of the graphs best represents the following function?
Which of the graphs best represents the following function?
Tap to reveal answer

The highest exponent of the variable term is two ( ). This tells that this function is quadratic, meaning that it is a parabola.
The graph below will be the answer, as it shows a parabolic curve.
The highest exponent of the variable term is two (
The graph below will be the answer, as it shows a parabolic curve.
← Didn't Know|Knew It →

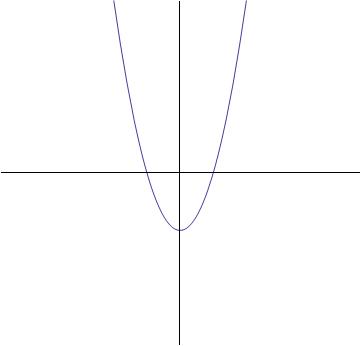
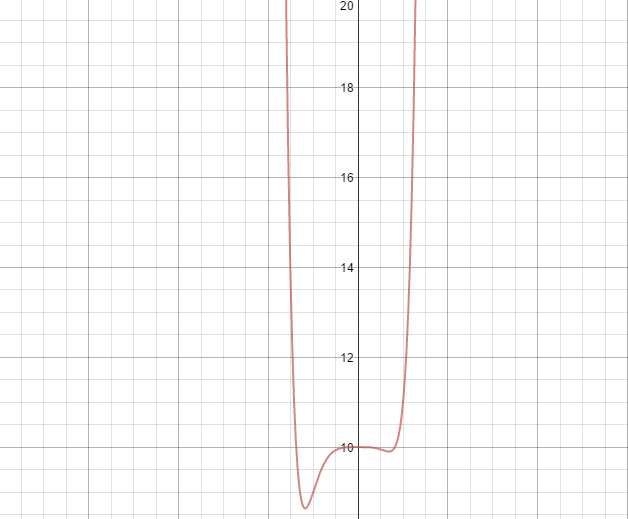
Where does the graph of ") cross the
cross the  axis?
axis?
Where does the graph of
Tap to reveal answer
To find where the graph crosses the horizontal axis, we need to set the function equal to 0, since the  value at any point along the
  axis is always zero.


To find the possible rational zeroes of a polynomial, use the rational zeroes theorem:

Our constant is 10, and our leading coefficient is 1. So here are our possible roots:

Let's try all of them and see if they work! We're going to substitute each value in for  using synthetic substitution. We'll try -1 first.

Looks like that worked! We got 0 as our final answer after synthetic substitution. What's left in the bottom row helps us factor ") down a little farther:
down a little farther:

We keep doing this process until ") is completely factored:
is completely factored:
=(x-5)(x-1)(x+1)(x+2)")
Thus, ") crosses the
crosses the  axis at
  .
.
To find where the graph crosses the horizontal axis, we need to set the function equal to 0, since the
To find the possible rational zeroes of a polynomial, use the rational zeroes theorem:
Our constant is 10, and our leading coefficient is 1. So here are our possible roots:
Let's try all of them and see if they work! We're going to substitute each value in for
Looks like that worked! We got 0 as our final answer after synthetic substitution. What's left in the bottom row helps us factor
We keep doing this process until
Thus,
← Didn't Know|Knew It →
How many  -intercepts does the graph of the following function have?
= $-4x^{2}$+ 12x - 9")
How many
Tap to reveal answer
The graph of a quadratic function  = $ax^{2}$+ bx + c") has an
has an  -intercept at any point
 ") at which
at which  = 0") , so, first, set the quadratic expression equal to 0:
, so, first, set the quadratic expression equal to 0:

The number of -intercepts of the graph is equal to the number of real zeroes of the above equation, which can be determined by evaluating the discriminant of the equation,  . Set
. Set  , and evaluate:

The discriminant is equal to zero, so the quadratic equation has one real zero, and the graph of ") has exactly one -intercept.
has exactly one -intercept.
The graph of a quadratic function
The number of
The discriminant is equal to zero, so the quadratic equation has one real zero, and the graph of
← Didn't Know|Knew It →

Where does ") cross the
cross the  axis?
axis?
Where does
Tap to reveal answer
") crosses the
crosses the  axis when
  equals 0. So, substitute in 0 for
  :
:
=7")
← Didn't Know|Knew It →
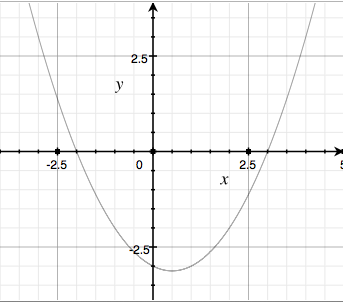
Which of the following is an equation for the above parabola?
Which of the following is an equation for the above parabola?
Tap to reveal answer
The zeros of the parabola are at  and
and  , so when placed into the formula
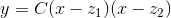 ,
,
each of their signs is reversed to end up with the correct sign in the answer. The coefficient can be found by plugging in any easily-identifiable, non-zero point to the above formula. For example, we can plug in ") which gives
which gives
(4+2)")


The zeros of the parabola are at
each of their signs is reversed to end up with the correct sign in the answer. The coefficient can be found by plugging in any easily-identifiable, non-zero point to the above formula. For example, we can plug in
← Didn't Know|Knew It →
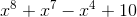
Turns on a polynomial graph.
What is the maximum number of turns the graph of the below polynomial function could have?

Turns on a polynomial graph.
What is the maximum number of turns the graph of the below polynomial function could have?
Tap to reveal answer
When determining the maximum number of turns a polynomial function might have, one must remember:
Max Number of Turns for Polynomial Function = degree - 1
First, we must find the degree, in order to determine the degree we must put the polynomial in standard form, which means organize the exponents in decreasing order:

Now that f(x) is in standard form, the degree is the largest exponent, which is 8.
We now plug this into the above:
Max Number of Turns for Polynomial Function = degree - 1
Max Number of Turns for Polynomial Function = 8 - 1
which is 7.
The correct answer is 7.
When determining the maximum number of turns a polynomial function might have, one must remember:
Max Number of Turns for Polynomial Function = degree - 1
First, we must find the degree, in order to determine the degree we must put the polynomial in standard form, which means organize the exponents in decreasing order:
Now that f(x) is in standard form, the degree is the largest exponent, which is 8.
We now plug this into the above:
Max Number of Turns for Polynomial Function = degree - 1
Max Number of Turns for Polynomial Function = 8 - 1
which is 7.
The correct answer is 7.
← Didn't Know|Knew It →
End Behavior
Determine the end behavior for ") below:
below:

End Behavior
Determine the end behavior for
Tap to reveal answer
In order to determine the end behavior of a polynomial function, it must first be rewritten in standard form. Standard form means that the function begins with the variable with the largest exponent and then ends with the constant or variable with the smallest exponent.
For f(x) in this case, it would be rewritten in this way:

When this is done, we can see that the function is an Even (degree, 4) Negative (leading coefficent, -3) which means that both sides of the graph go down infinitely.
In order to answer questions of this nature, one must remember the four ways that all polynomial graphs can look:
Even Positive:
\rightarrow\infty\and\ As\ x\rightarrow --\infty ; f(x)\rightarrow\infty")
Even Negative:
\rightarrow--\infty\and\ As\ x\rightarrow --\infty ; f(x)\rightarrow--\infty")
Odd Positive:
\rightarrow\infty\and\ As\ x\rightarrow --\infty ; f(x)\rightarrow--\infty")
Odd Negative:
\rightarrow--\infty\and\ As\ x\rightarrow --\infty ; f(x)\rightarrow\infty")
In order to determine the end behavior of a polynomial function, it must first be rewritten in standard form. Standard form means that the function begins with the variable with the largest exponent and then ends with the constant or variable with the smallest exponent.
For f(x) in this case, it would be rewritten in this way:
When this is done, we can see that the function is an Even (degree, 4) Negative (leading coefficent, -3) which means that both sides of the graph go down infinitely.
In order to answer questions of this nature, one must remember the four ways that all polynomial graphs can look:
Even Positive:
Even Negative:
Odd Positive:
Odd Negative:
← Didn't Know|Knew It →
Which of the following is a graph for the following equation:
Which of the following is a graph for the following equation:
Tap to reveal answer
The way to figure out this problem is by understanding behavior of polynomials.
The sign that occurs before the  is positive and therefore it is understood that the function will open upwards. the "8" on the function is an even number which means that the function is going to be u-shaped. The only answer choice that fits both these criteria is:
The way to figure out this problem is by understanding behavior of polynomials.
The sign that occurs before the
← Didn't Know|Knew It →