Midpoint Riemann Sums - AP Calculus AB
Card 0 of 2618
Using the method of midpoint Reimann sums, approximate the area of the region between the functions =10(1-e^{-x})") and
and =2x") over the interval
over the interval  using three midpoints.
Using the method of midpoint Reimann sums, approximate the area of the region between the functions
The Reimann sum approximation of an integral of a function with  subintervals over an interval
  takes the form:
dx \approx \frac{b-a}{n}[f(x_1)+f(x_2)+...+f(x_n)]")
Where  is the length of the subintervals.
For this problem, since there are three midpoints, the subintervals have length  , and the midpoints are
  .
.
Furthermore, since the question is asking for the area between the two functions, it's asking for the difference between the larger function over the interval, f(x), and the smaller function, g(x).
The integral is thus:
-g(x))dx \approx [(10(1-e^{-0.5})-2(0.5))+(10(1-e^{-1.5})-2(1.5))+(10(1-e^{-2.5})-2(2.5))]}")
-g(x))dx \approx 11.8825")
The Reimann sum approximation of an integral of a function with
Where
For this problem, since there are three midpoints, the subintervals have length
Furthermore, since the question is asking for the area between the two functions, it's asking for the difference between the larger function over the interval, f(x), and the smaller function, g(x).
The integral is thus:
Compare your answer with the correct one above
A Riemann Sum approximation of an integral )dx") follows the form
follows the form
") .
.
Where n is number of points/subintervals used to approximate the integral.
Knowing this, imagine a modified style of Riemann Sum, such that the subintervals are not of uniform width.
Denoting a particular subinterval's width as  ,
,
the integral approximation becomes
") .
.
Which of the following parameters would give the closest integral approximation of the function:
 ?
?
A Riemann Sum approximation of an integral
Where n is number of points/subintervals used to approximate the integral.
Knowing this, imagine a modified style of Riemann Sum, such that the subintervals are not of uniform width.
Denoting a particular subinterval's width as
the integral approximation becomes
Which of the following parameters would give the closest integral approximation of the function:
The more points/intervals that are selected, the closer the Reimann sum approximation becomes to the actual integral value, so n=20 will give a closer approximation than n=10:

Now, assuming the amount of points/intervals are fixed, but the actual widths can differ, it would be prudent to have narrower intervals at those regions where the graph is steepest. Relatively flatter regions of the function do not lead to the approximation overshooting or undershooting as much as the steeper areas, as can be seen in the above figure.
Consider the function  over the interval
  . The steepness of this graph at a point can be found by taking the function's derivative.
The quotient rule of derivatives states:

So the derivative is

}{x^3}")
It might be intuitive to see that the steepness is positive and that it gets progressively greater over the specified interval, although to be precise, we may take the derivative once more to find the rate of change of this steepness and see if it's postive or negative:
-4x^3(x^2e^x-2xe^x)}{x^8}")

}{x^4}")
Since this derivative is positive over the specified interval, , and since the slope was shown to be positive as well, the slope is ever-increasing and growing steeper.
The intervals should in turn grow increasingly thinner.
The more points/intervals that are selected, the closer the Reimann sum approximation becomes to the actual integral value, so n=20 will give a closer approximation than n=10:
Now, assuming the amount of points/intervals are fixed, but the actual widths can differ, it would be prudent to have narrower intervals at those regions where the graph is steepest. Relatively flatter regions of the function do not lead to the approximation overshooting or undershooting as much as the steeper areas, as can be seen in the above figure.
Consider the function
The quotient rule of derivatives states:
So the derivative is
It might be intuitive to see that the steepness is positive and that it gets progressively greater over the specified interval, although to be precise, we may take the derivative once more to find the rate of change of this steepness and see if it's postive or negative:
Since this derivative is positive over the specified interval, , and since the slope was shown to be positive as well, the slope is ever-increasing and growing steeper.
The intervals should in turn grow increasingly thinner.
Compare your answer with the correct one above
The general Reimann Sum approximation of an integral dx") takes the form
takes the form
")
Where  is the number of points/subintervals, and each subinterval is of uniform width
  .
.
Knowing this, imagine that the subintervals are not of uniform width.
Denoting a particular subinterval's width as  ,
,
the integral approximation becomes
")
Which of the following parameters would give the closest integral approximation of the function:
dx") ?
?
The general Reimann Sum approximation of an integral
Where
Knowing this, imagine that the subintervals are not of uniform width.
Denoting a particular subinterval's width as
the integral approximation becomes
Which of the following parameters would give the closest integral approximation of the function:
The more points/intervals that are selected, the closer the Reimann sum approximation becomes to the actual integral value, so n=50 will give a closer approximation than n=40:
Now, assuming the amount of points/intervals are fixed, but the actual widths can differ, it would be prudent to have narrower intervals at those regions where the graph is steepest. Relatively flatter regions of the function do not lead to the approximation overshooting or undershooting as much as the steeper areas, as can be seen in the above figure.
To determine how the widths of the intervals should change if they should, determine whether or not the function is getting steeper or flatter. The function will be getting steeper over an interval if the 1st and 2nd derivatives have the same sign over this interval.
The first derivative is the slope. The second derivative is the rate of change of the slope. If the rate of change has the same sign as the slope, it is pushing the absolute value of the slope away from 0. Since 0 indicates flatness, this means that the function is growing steeper. The opposite holds if the signs are opposite!
First find the derivative of the function  :
:

This can be rewritten as
(x-2)")
Thus for all values for x outside of 2, the slope is positive, though as the function is continuous, a single point is nigh negligible.
Now take the second derivative:

For the interval  , the second derivative is negative.
Since the signs of the first and second derivatives are opposing, the function is flattening out. The intervals should grow wider.
The more points/intervals that are selected, the closer the Reimann sum approximation becomes to the actual integral value, so n=50 will give a closer approximation than n=40:
Now, assuming the amount of points/intervals are fixed, but the actual widths can differ, it would be prudent to have narrower intervals at those regions where the graph is steepest. Relatively flatter regions of the function do not lead to the approximation overshooting or undershooting as much as the steeper areas, as can be seen in the above figure.
To determine how the widths of the intervals should change if they should, determine whether or not the function is getting steeper or flatter. The function will be getting steeper over an interval if the 1st and 2nd derivatives have the same sign over this interval.
The first derivative is the slope. The second derivative is the rate of change of the slope. If the rate of change has the same sign as the slope, it is pushing the absolute value of the slope away from 0. Since 0 indicates flatness, this means that the function is growing steeper. The opposite holds if the signs are opposite!
First find the derivative of the function
This can be rewritten as
Thus for all values for x outside of 2, the slope is positive, though as the function is continuous, a single point is nigh negligible.
Now take the second derivative:
For the interval
Since the signs of the first and second derivatives are opposing, the function is flattening out. The intervals should grow wider.
Compare your answer with the correct one above
The general Reimann Sum approximation of an integral takes the form
Where is the number of points/subintervals, and each subinterval is of uniform width .
Knowing this, imagine that the subintervals are not of uniform width.
Denoting a particular subinterval's width as ,
the integral approximation becomes
Which of the following parameters would give the closest integral approximation of the function:
dx") ?
?
The general Reimann Sum approximation of an integral
Where
Knowing this, imagine that the subintervals are not of uniform width.
Denoting a particular subinterval's width as
the integral approximation becomes
Which of the following parameters would give the closest integral approximation of the function:
The more points/intervals that are selected, the closer the Reimann sum approximation becomes to the actual integral value, so  will give a closer approximation than
  :
:
Now, assuming the amount of points/intervals are fixed, but the actual widths can differ, it would be prudent to have narrower intervals at those regions where the graph is steepest. Relatively flatter regions of the function do not lead to the approximation overshooting or undershooting as much as the steeper areas, as can be seen in the above figure.
To determine how the widths of the intervals should change if they should, determine whether or not the function is getting steeper or flatter. The function will be getting steeper over an interval if the 1st and 2nd derivatives have the same sign over this interval.
The first derivative is the slope. The second derivative is the rate of change of the slope. If the rate of change has the same sign as the slope, it is pushing the absolute value of the slope away from 0. Since 0 indicates flatness, this means that the function is growing steeper. The opposite holds if the signs are opposite!
For the function
")
The derivative can be found, using the product rule =udv+vdu") :
:
+x\frac{1}{x}")
+1")
Over the entire interval  , this function is negative. Now, consider the second derivative:

Over the interval  , the function is positive.
Since the first and second derivatives have opposing signs, the function is flattening out. The subintervals should grow progressively thicker.
The more points/intervals that are selected, the closer the Reimann sum approximation becomes to the actual integral value, so
Now, assuming the amount of points/intervals are fixed, but the actual widths can differ, it would be prudent to have narrower intervals at those regions where the graph is steepest. Relatively flatter regions of the function do not lead to the approximation overshooting or undershooting as much as the steeper areas, as can be seen in the above figure.
To determine how the widths of the intervals should change if they should, determine whether or not the function is getting steeper or flatter. The function will be getting steeper over an interval if the 1st and 2nd derivatives have the same sign over this interval.
The first derivative is the slope. The second derivative is the rate of change of the slope. If the rate of change has the same sign as the slope, it is pushing the absolute value of the slope away from 0. Since 0 indicates flatness, this means that the function is growing steeper. The opposite holds if the signs are opposite!
For the function
The derivative can be found, using the product rule
Over the entire interval
Over the interval
Since the first and second derivatives have opposing signs, the function is flattening out. The subintervals should grow progressively thicker.
Compare your answer with the correct one above
The general Riemann Sum approximation of an integral takes the form
Where is the number of points/subintervals, and each subinterval is of uniform width .
Knowing this, imagine that the subintervals are not of uniform width.
Denoting a particular subinterval's width as ,
the integral approximation becomes
Which of the following parameters would give the closest integral approximation of the function:
 ?
?
The general Riemann Sum approximation of an integral
Where
Knowing this, imagine that the subintervals are not of uniform width.
Denoting a particular subinterval's width as
the integral approximation becomes
Which of the following parameters would give the closest integral approximation of the function:
The more points/intervals that are selected, the closer the Riemann sum approximation becomes to the actual integral value, so n=16 will give a closer approximation than n=8:
Now, assuming the amount of points/intervals are fixed, but the actual widths can differ, it would be prudent to have narrower intervals at those regions where the graph is steepest. Relatively flatter regions of the function do not lead to the approximation overshooting or undershooting as much as the steeper areas, as can be seen in the above figure.
To determine how the widths of the intervals should change if they should, determine whether or not the function is getting steeper or flatter. The function will be getting steeper over an interval if the 1st and 2nd derivatives have the same sign over this interval.
The first derivative is the slope. The second derivative is the rate of change of the slope. If the rate of change has the same sign as the slope, it is pushing the absolute value of the slope away from 0. Since 0 indicates flatness, this means that the function is growing steeper. The opposite holds if the signs are opposite!
Considering =\frac{1}{2}^{x^2-2x+1}") , find the first derivative:
, find the first derivative:
=a^uln(a)du")
=(2x-2)\frac{1}{2}^{x^2-2x+1}ln(\frac{1}{2})")
The term in the parenthesis is what may lend to variability in the sign. Over the interval  the parenthetical is negative, so the derivative is positive, since
 =-0.693") , and the product of two negatives is positive. Now consider the second derivative:
, and the product of two negatives is positive. Now consider the second derivative:
=udv+vdu")
=\frac{1}{2}^{x^2-2x+2}ln(\frac{1}{2})+(2x-2)^2\frac{1}{2}^{x^2-2x+1}ln^2(\frac{1}{2})")
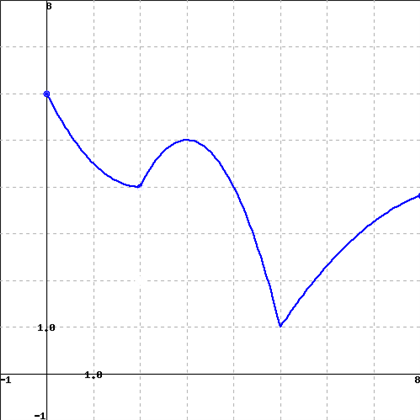
The second term will always be positive, and the first term will always be negative. On the interval  , it can be found, however, that the second derivative will be positive. If calculating this is to nettlesome, plot this function on the interval:

Since the first and second derivatives have opposite signs, the function is getting flatter. The intervals should in turn get wider.
The more points/intervals that are selected, the closer the Riemann sum approximation becomes to the actual integral value, so n=16 will give a closer approximation than n=8:
Now, assuming the amount of points/intervals are fixed, but the actual widths can differ, it would be prudent to have narrower intervals at those regions where the graph is steepest. Relatively flatter regions of the function do not lead to the approximation overshooting or undershooting as much as the steeper areas, as can be seen in the above figure.
To determine how the widths of the intervals should change if they should, determine whether or not the function is getting steeper or flatter. The function will be getting steeper over an interval if the 1st and 2nd derivatives have the same sign over this interval.
The first derivative is the slope. The second derivative is the rate of change of the slope. If the rate of change has the same sign as the slope, it is pushing the absolute value of the slope away from 0. Since 0 indicates flatness, this means that the function is growing steeper. The opposite holds if the signs are opposite!
Considering
The term in the parenthesis is what may lend to variability in the sign. Over the interval
The second term will always be positive, and the first term will always be negative. On the interval
Since the first and second derivatives have opposite signs, the function is getting flatter. The intervals should in turn get wider.
Compare your answer with the correct one above
The general Riemann Sum approximation of an integral takes the form
Where is the number of points/subintervals, and each subinterval is of uniform width .
Knowing this, imagine that the subintervals are not of uniform width.
Denoting a particular subinterval's width as ,
the integral approximation becomes
Which of the following parameters would give the closest integral approximation of the function:
dx") ?
?
The general Riemann Sum approximation of an integral
Where
Knowing this, imagine that the subintervals are not of uniform width.
Denoting a particular subinterval's width as
the integral approximation becomes
Which of the following parameters would give the closest integral approximation of the function:
The more points/intervals that are selected, the closer the Riemann sum approximation becomes to the actual integral value, so n=16 will give a closer approximation than n=8:
Now, assuming the amount of points/intervals are fixed, but the actual widths can differ, it would be prudent to have narrower intervals at those regions where the graph is steepest. Relatively flatter regions of the function do not lead to the approximation overshooting or undershooting as much as the steeper areas, as can be seen in the above figure.
To determine how the widths of the intervals should change if they should, determine whether or not the function is getting steeper or flatter. The function will be getting steeper over an interval if the 1st and 2nd derivatives have the same sign over this interval.
The first derivative is the slope. The second derivative is the rate of change of the slope. If the rate of change has the same sign as the slope, it is pushing the absolute value of the slope away from 0. Since 0 indicates flatness, this means that the function is growing steeper. The opposite holds if the signs are opposite!
Considering =cos(\frac{x^2}{\pi})") take the first derivative:
take the first derivative:
)=-sin(u)du")
=-\frac{2x}{\pi}sin(\frac{x^2}{\pi})")
Within the interval  this function is negative. Now consider the second derivative:
=udv+vdu")
=-\frac{2}{\pi}sin(\frac{x^2}{\pi})-\frac{4x^2}{\pi^2}cos(\frac{x^2}{\pi})")
Over the interval  , the second derivative is negative as well.
Since the signs match, the slope gets steeper, and the intervals should get thinner.
The more points/intervals that are selected, the closer the Riemann sum approximation becomes to the actual integral value, so n=16 will give a closer approximation than n=8:
Now, assuming the amount of points/intervals are fixed, but the actual widths can differ, it would be prudent to have narrower intervals at those regions where the graph is steepest. Relatively flatter regions of the function do not lead to the approximation overshooting or undershooting as much as the steeper areas, as can be seen in the above figure.
To determine how the widths of the intervals should change if they should, determine whether or not the function is getting steeper or flatter. The function will be getting steeper over an interval if the 1st and 2nd derivatives have the same sign over this interval.
The first derivative is the slope. The second derivative is the rate of change of the slope. If the rate of change has the same sign as the slope, it is pushing the absolute value of the slope away from 0. Since 0 indicates flatness, this means that the function is growing steeper. The opposite holds if the signs are opposite!
Considering
Within the interval
Over the interval
Since the signs match, the slope gets steeper, and the intervals should get thinner.
Compare your answer with the correct one above
The general Riemann Sum approximation of an integral takes the form
Where is the number of points/subintervals, and each subinterval is of uniform width .
Knowing this, imagine that the subintervals are not of uniform width.
Denoting a particular subinterval's width as ,
the integral approximation becomes
Which of the following parameters would give the closest integral approximation of the function:
}dx") ?
?
The general Riemann Sum approximation of an integral
Where
Knowing this, imagine that the subintervals are not of uniform width.
Denoting a particular subinterval's width as
the integral approximation becomes
Which of the following parameters would give the closest integral approximation of the function:
The more points/intervals that are selected, the closer the Riemann sum approximation becomes to the actual integral value, so n=16 will give a closer approximation than n=8:
Now, assuming the amount of points/intervals are fixed, but the actual widths can differ, it would be prudent to have narrower intervals at those regions where the graph is steepest. Relatively flatter regions of the function do not lead to the approximation overshooting or undershooting as much as the steeper areas, as can be seen in the above figure.
To determine how the widths of the intervals should change if they should, determine whether or not the function is getting steeper or flatter. The function will be getting steeper over an interval if the 1st and 2nd derivatives have the same sign over this interval.
The first derivative is the slope. The second derivative is the rate of change of the slope. If the rate of change has the same sign as the slope, it is pushing the absolute value of the slope away from 0. Since 0 indicates flatness, this means that the function is growing steeper. The opposite holds if the signs are opposite!
Considering = e^{cos(x)}") , find the first derivative:
, find the first derivative:
=e^udu")
)=-sin(u)du")
=-sin(x)e^{cos(x)}")
Within the interval  , the function only takes negative values. Now, take the second derivative:
=udv+vdu")
=-cos(x)e^{cos(x)}+sin^2(x)e^{cos(x)}")
On the interval  , this function takes on positive values.
Since the signs of the derivatives are opposing, the function gets flatter over the course of this interval, and the subintervals should thus get wider.
The more points/intervals that are selected, the closer the Riemann sum approximation becomes to the actual integral value, so n=16 will give a closer approximation than n=8:
Now, assuming the amount of points/intervals are fixed, but the actual widths can differ, it would be prudent to have narrower intervals at those regions where the graph is steepest. Relatively flatter regions of the function do not lead to the approximation overshooting or undershooting as much as the steeper areas, as can be seen in the above figure.
To determine how the widths of the intervals should change if they should, determine whether or not the function is getting steeper or flatter. The function will be getting steeper over an interval if the 1st and 2nd derivatives have the same sign over this interval.
The first derivative is the slope. The second derivative is the rate of change of the slope. If the rate of change has the same sign as the slope, it is pushing the absolute value of the slope away from 0. Since 0 indicates flatness, this means that the function is growing steeper. The opposite holds if the signs are opposite!
Considering
Within the interval
On the interval
Since the signs of the derivatives are opposing, the function gets flatter over the course of this interval, and the subintervals should thus get wider.
Compare your answer with the correct one above
The general Riemann Sum approximation of an integral takes the form
Where is the number of points/subintervals, and each subinterval is of uniform width .
Knowing this, imagine that the subintervals are not of uniform width.
Denoting a particular subinterval's width as ,
the integral approximation becomes
Which of the following parameters would give the closest integral approximation of the function:
}^{ln(\pi)} sin(e^{x})dx") ?
?
The general Riemann Sum approximation of an integral
Where
Knowing this, imagine that the subintervals are not of uniform width.
Denoting a particular subinterval's width as
the integral approximation becomes
Which of the following parameters would give the closest integral approximation of the function:
The more points/intervals that are selected, the closer the Riemann sum approximation becomes to the actual integral value, so n=16 will give a closer approximation than n=8:
Now, assuming the amount of points/intervals are fixed, but the actual widths can differ, it would be prudent to have narrower intervals at those regions where the graph is steepest. Relatively flatter regions of the function do not lead to the approximation overshooting or undershooting as much as the steeper areas, as can be seen in the above figure.
To determine how the widths of the intervals should change if they should, determine whether or not the function is getting steeper or flatter. The function will be getting steeper over an interval if the 1st and 2nd derivatives have the same sign over this interval.
The first derivative is the slope. The second derivative is the rate of change of the slope. If the rate of change has the same sign as the slope, it is pushing the absolute value of the slope away from 0. Since 0 indicates flatness, this means that the function is growing steeper. The opposite holds if the signs are opposite!
Considering the function =sin(e^{x})") , take the first derivative:
, take the first derivative:
)=cos(u)du")
=e^udu")
=e^xcos(e^{x})")
Over the interval ,ln(\pi)]") this function is negative due to the cosine term. Now take the second derivative:
this function is negative due to the cosine term. Now take the second derivative:
=udv+vdu")
=e^xcos(e^{x})-e^{2x}sin(x)")
This function is also negative over the interval ,ln(\pi)]") .
.
Since both derivatives share a sign, the function grows steeper over the specified interval. The subintervals should therefore get progressively narrower.
The more points/intervals that are selected, the closer the Riemann sum approximation becomes to the actual integral value, so n=16 will give a closer approximation than n=8:
Now, assuming the amount of points/intervals are fixed, but the actual widths can differ, it would be prudent to have narrower intervals at those regions where the graph is steepest. Relatively flatter regions of the function do not lead to the approximation overshooting or undershooting as much as the steeper areas, as can be seen in the above figure.
To determine how the widths of the intervals should change if they should, determine whether or not the function is getting steeper or flatter. The function will be getting steeper over an interval if the 1st and 2nd derivatives have the same sign over this interval.
The first derivative is the slope. The second derivative is the rate of change of the slope. If the rate of change has the same sign as the slope, it is pushing the absolute value of the slope away from 0. Since 0 indicates flatness, this means that the function is growing steeper. The opposite holds if the signs are opposite!
Considering the function
Over the interval
This function is also negative over the interval
Since both derivatives share a sign, the function grows steeper over the specified interval. The subintervals should therefore get progressively narrower.
Compare your answer with the correct one above
Let =x^3")
What is the Midpoint Riemann Sum on the interval  divided into four sub-intervals?
Let
What is the Midpoint Riemann Sum on the interval
The interval  divided into four sub-intervals gives rectangles with vertices of the bases at

For the Midpoint Riemann sum, we need to find the rectangle heights which values come from the midpoint of the sub-intervals, or f(1), f(3), f(5), and f(7).
=1^3=1")
=3^3=27")
=5^3=125")
=7^3=343")
Because each interval has width 2, the approximated Midpoint Riemann Sum is
=992")
The interval
For the Midpoint Riemann sum, we need to find the rectangle heights which values come from the midpoint of the sub-intervals, or f(1), f(3), f(5), and f(7).
Because each interval has width 2, the approximated Midpoint Riemann Sum is
Compare your answer with the correct one above
Estimate the area under the curve for the following function using a midpoint Riemann sum from  to
to  with
with  .
.
=\frac{1}{2}x^3+4")
Estimate the area under the curve for the following function using a midpoint Riemann sum from
If we want to estimate the area under the curve from  to
to  and are told to use
  , this means we estimate the area using two rectangles that will each be two units wide and whose height is the value of the function at the midpoint of the interval. We have a rectangle from
  to
to  , whose height is the value of the function at
  , and a rectangle from
  to
to  , whose height is the value of the function at
  . First we can find the value of the function at these midpoints, and then add the areas of the two rectangles, which gives us the following:
=\frac{1}{2}(1)^3+4=\frac{9}{2}")
=\frac{1}{2}(3)^3+4=\frac{35}{2}")
+2\left(\frac{35}{2}\right)=44")
If we want to estimate the area under the curve from
Compare your answer with the correct one above
Estimate the area under the curve for the following function from  to
to  using a midpoint Riemann sum with
  rectangles:
=\frac{1}{4}x^2+3")
Estimate the area under the curve for the following function from
If we are told to use  rectangles from
  to
to  , this means we have a rectangle from
  to
to  , a rectangle from
  to
to  , a rectangle from
  to
to  , and a rectangle from
  to
to  . We can see that the width of each rectangle is
  because we have an interval that is
  units long for which we are using
  rectangles to estimate the area under the curve. The height of each rectangle is the value of the function at the midpoint for its interval, so first we find the height of each rectangle and then add together their areas to find our answer:
=\frac{1}{4}(0.5)^2+3=\frac{49}{16}")
=\frac{1}{4}(1.5)^2+3=\frac{57}{16}")
=\frac{1}{4}(2.5)^2+3=\frac{73}{16}")
=\frac{1}{4}(3.5)^2+3=\frac{97}{16}")
\left(\frac{49}{16}\right)+(1)\left(\frac{57}{16}\right)+(1)\left(\frac{73}{16}\right)+(1)\left(\frac{97}{16}\right)=\frac{276}{16}=\frac{69}{4}")
If we are told to use
Compare your answer with the correct one above
Using 4 intervals, calculate the midpoint Riemann sum approximation of the area under the curve defined by  = 3x^2 + 5x + 6") on the interval
on the interval  .
.
Using 4 intervals, calculate the midpoint Riemann sum approximation of the area under the curve defined by
To make 4 intervals, we need 5 boundary lines. In this case, they are the vertical lines at  . So the midpoints of each interval are at
  , respectively.
The area of each region is found by \cdot \Delta x") , where
, where  is the width of the interval (here, 2). So we simply need to find the functional value at each
  -coordinate of the midpoints above, multiply by 2, and sum. Equivalently, we could sum the functional values, then double the sum.
 = 14")
 = 48")
 = 106")
 = 188")
Their sum is  , and twice that is
  .
.
The wrong answer  comes from using
  as the midpoints.
The wrong answer  comes from using
  as the midpoints.
To make 4 intervals, we need 5 boundary lines. In this case, they are the vertical lines at
The area of each region is found by
Their sum is
The wrong answer
The wrong answer
Compare your answer with the correct one above
Find the area under  on the interval
  using five midpoint Riemann sums.
Find the area under
The problem becomes this:

Addings these rectangles up to approximate the area under the curve is
+0.2(1-0.3^2)+0.2(1-0.5^2)+0.2(1-0.7^2)+0.2(1-0.9^2)")
+(1-0.3^2)+(1-0.5^2)+(1-0.7^2)+(1-0.9^2)]")


The problem becomes this:
Addings these rectangles up to approximate the area under the curve is
Compare your answer with the correct one above
Approximate the area under the curve from  using the midpoint Riemann Sum with a partition of size five given the graph of the function.
Approximate the area under the curve from
We begin by finding the given change in x:

We then define our partition intervals:
,[1.6,3.2),[3.2,4.8),[4.8,6.4),[6.4,8]")
We then choose the midpoint in each interval:

Then we find the value of the function at the point. This is determined through observation of the graph
\approx 4.8,4.5,4,1.6,3.4")
Then we simply substitute these values into the formula for the Riemann Sum
\Delta x=4.8\cdot 1.6+4.5\cdot 1.6+4\cdot 1.6+1.6\cdot 1.6+3.4\cdot 1.6\ =1.6(4.8+4.5+4+1.6+3.4)=1.6\cdot 18.3=29.28")
We begin by finding the given change in x:
We then define our partition intervals:
We then choose the midpoint in each interval:
Then we find the value of the function at the point. This is determined through observation of the graph
Then we simply substitute these values into the formula for the Riemann Sum
Compare your answer with the correct one above
Approximate the area underneath the given curve using the Riemann Sum with eight intervals for  .
.
=2x^3-5x^2+9x-5")
Approximate the area underneath the given curve using the Riemann Sum with eight intervals for
We begin by defining the size of our partitions and the partitions themselves.


We then choose the midpoint in each interval:

Then we find the function value at each point.
=-131,-21,1,31,165,499,1129,2151")
We then substitute these values into the Riemann Sum formula.
\Delta x=2(-131-21+1+31+165+499+1129+2151)=7648")
We begin by defining the size of our partitions and the partitions themselves.
We then choose the midpoint in each interval:
Then we find the function value at each point.
We then substitute these values into the Riemann Sum formula.
Compare your answer with the correct one above
Solve the integral

using the midpoint Riemann sum approximation with  subintervals.
Solve the integral
using the midpoint Riemann sum approximation with
Midpoint Riemann sum approximations are solved using the formula
)dx\approx (\frac{b-a}{n})\left [ f({m_{1}})+f({m_{2}})+...+f({m_{n}}) \right ]")
where  is the number of subintervals and
 ") is the function evaluated at the midpoint.
is the function evaluated at the midpoint.
For this problem, =(\frac{7-3}{10})=0.4") .
.
The approximate value at each midpoint is below.

The sum of all the approximate midpoints values is  , therefore
\left [ f({m_{1}})+f({m_{2}})+...+f({m_{n}}) \right ] =0.4(2.116738)\approx0.8467")
Midpoint Riemann sum approximations are solved using the formula
where
For this problem,
The approximate value at each midpoint is below.
The sum of all the approximate midpoints values is
Compare your answer with the correct one above
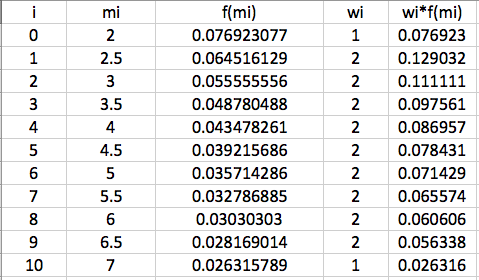
Solve the integral

using the midpoint Riemann sum approximation with  subintervals.
Solve the integral
using the midpoint Riemann sum approximation with
Midpoint Riemann sum approximations are solved using the formula
)dx\approx (\frac{b-a}{n})\left [ f({m_{1}})+f({m_{2}})+...+f({m_{n}}) \right ]")
where  is the number of subintervals and
 ") is the function evaluated at the midpoint.
is the function evaluated at the midpoint.
For this problem, =(\frac{8-1}{10})=0.7") .
.
The approximate value at each midpoint is below.

The sum of all the approximate midpoints values is  , therefore
\left [ f({m_{1}})+f({m_{2}})+...+f({m_{n}}) \right ] =0.7(20.6068259)\approx14.4248")
Midpoint Riemann sum approximations are solved using the formula
where
For this problem,
The approximate value at each midpoint is below.
The sum of all the approximate midpoints values is
Compare your answer with the correct one above
Solve the integral
dx")
using the midpoint Riemann sum approximation with  subintervals.
Solve the integral
using the midpoint Riemann sum approximation with
Midpoint Riemann sum approximations are solved using the formula
where  is the number of subintervals and
 ") is the function evaluated at the midpoint.
is the function evaluated at the midpoint.
For this problem, =(\frac{\pi /2-0}{10})=\pi/20\approx0.1571") .
.
The approximate value at each midpoint is below.

The sum of all the approximate midpoints values is  , therefore
\left [ f({m_{1}})+f({m_{2}})+...+f({m_{n}}) \right ] =0.1571(6.37275)\approx1")
Midpoint Riemann sum approximations are solved using the formula
where
For this problem,
The approximate value at each midpoint is below.
The sum of all the approximate midpoints values is
Compare your answer with the correct one above
Solve the integral

using the midpoint Riemann sum approximation with  subintervals.
Solve the integral
using the midpoint Riemann sum approximation with
Midpoint Riemann sum approximations are solved using the formula
where  is the number of subintervals and
 ") is the function evaluated at the midpoint.
is the function evaluated at the midpoint.
For this problem, =(\frac{5-2}{10})=0.3") .
.
The approximate value at each midpoint is below.

The sum of all the approximate midpoints values is  , therefore
\left [ f({m_{1}})+f({m_{2}})+...+f({m_{n}}) \right ] =0.3(468.3221)\approx140.4966")
Midpoint Riemann sum approximations are solved using the formula
where
For this problem,
The approximate value at each midpoint is below.
The sum of all the approximate midpoints values is
Compare your answer with the correct one above
Solve the integral

using the trapezoidal approximation with  subintervals.
Solve the integral
using the trapezoidal approximation with
Trapezoidal approximations are solved using the formula
)dx\approx T_{n}=(\frac{b-a}{2n})\left [ f(0)+2f(1)+...+f(m-1)+f(m) \right ]")
where  is the number of subintervals and
 ") is the function evaluated at the midpoint.
is the function evaluated at the midpoint.
For this problem, =(\frac{7-2}{2*5})=0.5") .
.
The value of each approximation term is below.
The sum of all the approximation terms is  , therefore
\left [ f(0)+2f(1)+...+f(m-1)+f(m) \right ]=(0.5)*(0.86027754)=0.4301")
Trapezoidal approximations are solved using the formula
where
For this problem,
The value of each approximation term is below.
The sum of all the approximation terms is
Compare your answer with the correct one above