Data Analysis and Probability

Help Questions

ISEE Lower Level Quantitative Reasoning › Data Analysis and Probability

Questions 1 - 10
1

What is the next number in the series?

Explanation

First, determine what the pattern is in the series. The pattern here is to multiply the previous number by 2 and then add 1. Therefore, multiply 47 by 2 (which is 94), and then add 1. The result is 95.

2

What is the next number in the series?

Explanation

First, determine what the pattern is in the series. The pattern here is to multiply the previous number by 2 and then add 1. Therefore, multiply 47 by 2 (which is 94), and then add 1. The result is 95.

3

What is the next number in the series?

Explanation

First, determine what the pattern is in the series. The pattern here is to multiply the previous number by 2 and then add 1. Therefore, multiply 47 by 2 (which is 94), and then add 1. The result is 95.

4

Look at the chart below. If we add more apples, how many more apples will we have?

Screen shot 2015 09 18 at 11.59.56 am

Explanation

Looking at the graph, we first need to figure out how many apples we are starting with. We are starting with apples and we are going to add more apples, which means we will have apples.

5

Look at the chart below. How many grapes are there?

Screen shot 2015 09 18 at 11.59.56 am

Explanation

In the chart, grapes are shown in the last bar, on the right. That bar goes up to the number , which means there are grapes.

6

Kate's class is going to plant flowers outside of their class window. To help decide what flower to plant, her teacher took a class vote.

Use the graph below to help answer the question.

Screen shot 2016 01 04 at 10.46.34 am

What is the label of the x-axis?

Type of Flower

Number of Votes

Favorite Flower

Kate's Class

Explanation

A graph is made up of an x-axis and a y-axis. The x-axis of a graph is always the horizontal line (a line that runs from left to right) and the y-axis is alway the vertical line (a line that runs from top to bottom)

The x-axis of this graph is labeled "Type of Flower".

7

During a basketball game, 3 of the players on a team make 4 baskets each, while the other 2 players only make 1 basket each. What is the mean number of baskets that each player made during the game?

Explanation

The mean is calculated by finding the sum of the numbers in a set, and then dividing that sum by the number of items in the set. Given that 3 of the players made 4 baskets each, while the other 2 players only made only 1 basket each, the equation for finding the mean would look like this (there are 5 players on the team, and so there are 5 items in the set):

8

During a basketball game, 3 of the players on a team make 4 baskets each, while the other 2 players only make 1 basket each. What is the mean number of baskets that each player made during the game?

Explanation

The mean is calculated by finding the sum of the numbers in a set, and then dividing that sum by the number of items in the set. Given that 3 of the players made 4 baskets each, while the other 2 players only made only 1 basket each, the equation for finding the mean would look like this (there are 5 players on the team, and so there are 5 items in the set):

9

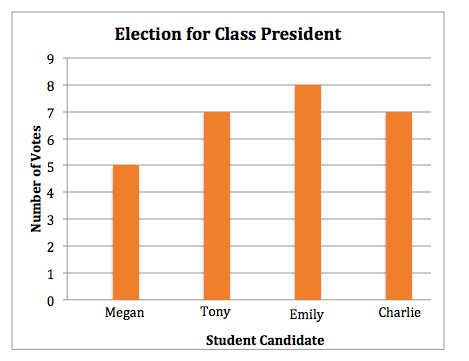
Mrs. Ryan's class had their class election today for their class president. The results are displayed in the chart below.

Use the graph below to help answer the question.
Screen shot 2016 01 04 at 10.39.00 am

How many people voted for Megan?

Explanation

The bar for Megan is the first bar on the left. The bar raises to the number , which means people voted for Megan.

10

Define two sets as follows:

How many elements are in ?

Explanation

is the intersection of sets and - the set of all elements that appear in both sets. As can be seen, those elements are - making 3 the correct choice.

Page 1 of 64
Return to subject