Data Analysis and Statistics - SAT Math
Card 0 of 780

Using the data above, find the IQR. (interquartile range)
Using the data above, find the IQR. (interquartile range)
How do you find the interquartile range?
We can find the interquartile range or IQR in four simple steps:
- Order the data from least to greatest
- Find the median
- Calculate the median of both the lower and upper half of the data
- The IQR is the difference between the upper and lower medians
Step 1: Order the data
In order to calculate the IQR, we need to begin by ordering the values of the data set from the least to the greatest. Likewise, in order to calculate the median, we need to arrange the numbers in ascending order (i.e. from the least to the greatest).
Let's sort an example data set with an odd number of values into ascending order.

}: 2, 2, 3, 3, 4, 5, 6, 9, 11")
Now, let's perform this task with another example data set that is comprised of an even number of values.

Rearrange into ascending order.
}: 1, 2, 2, 3, 4, 4, 7, 8, 9, 11")
Step 2: Calculate the median
Next, we need to calculate the median. The median is the "center" of the data. If the data set has an odd number of data points, then the mean is the centermost number. On the other hand, if the data set has an even number of values, then we will need to take the arithmetic average of the two centermost values. We will calculate this average by adding the two numbers together and then dividing that number by two.
First, we will find the median of a set with an odd number of values. Cross out values until you find the centermost point

The median of the odd valued data set is four.
Now, let's find the mean of the data set with an even number of values. Cross out values until you find the two centermost points and then calculate the average the two values.

Find the average of the two centermost values.


The median of the even valued set is four.
Step 3: Upper and lower medians
Once we have found the median of the entire set, we can find the medians of the upper and lower portions of the data. If the data set has an odd number of values, we will omit the median or centermost value of the set. Afterwards, we will find the individual medians for the upper and lower portions of the data.

Omit the centermost value.

Find the median of the lower portion.

Calculate the average of the two values.


The median of the lower portion is 
Find the median of the upper portion.

Calculate the average of the two values.


The median of the upper potion is 
If the data set has an even number of values, we will use the two values used to calculate the original median to divide the data set. These values are not omitted and become the largest value of the lower data set and the lowest values of the upper data set, respectively. Afterwards, we will calculate the medians of both the upper and lower portions.

Find the median of the lower portion.

The median of the lower portion is two.
Find the median of the upper portion.

The median of the upper portion is eight.
Step 4: Calculate the difference
Last, we need to calculate the difference of the upper and lower medians by subtracting the lower median from the upper median. This value equals the IQR.
Let's find the IQR of the odd data set.


Finally, we will find the IQR of the even data set.


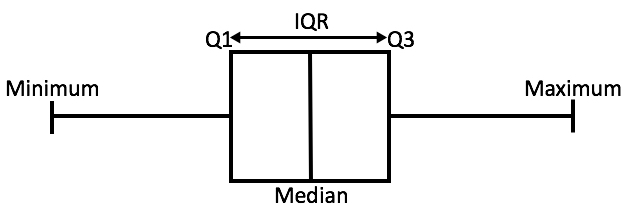
In order to better illustrate these values, their positions in a box plot have been labeled in the provided image.
Now that we have solved a few examples, let's use this knowledge to solve the given problem.
Solution:
To find the IQR, we must first find the  and
and  .
.
The  is the median of the upper quartile, the numbers above the median:
 ,
,
thus the  is
is 
 is the median of the lower quartile:
 ,
,
thus the  is
is  .
.
So,  .
.
How do you find the interquartile range?
We can find the interquartile range or IQR in four simple steps:
- Order the data from least to greatest
- Find the median
- Calculate the median of both the lower and upper half of the data
- The IQR is the difference between the upper and lower medians
Step 1: Order the data
In order to calculate the IQR, we need to begin by ordering the values of the data set from the least to the greatest. Likewise, in order to calculate the median, we need to arrange the numbers in ascending order (i.e. from the least to the greatest).
Let's sort an example data set with an odd number of values into ascending order.
Now, let's perform this task with another example data set that is comprised of an even number of values.
Rearrange into ascending order.
Step 2: Calculate the median
Next, we need to calculate the median. The median is the "center" of the data. If the data set has an odd number of data points, then the mean is the centermost number. On the other hand, if the data set has an even number of values, then we will need to take the arithmetic average of the two centermost values. We will calculate this average by adding the two numbers together and then dividing that number by two.
First, we will find the median of a set with an odd number of values. Cross out values until you find the centermost point
The median of the odd valued data set is four.
Now, let's find the mean of the data set with an even number of values. Cross out values until you find the two centermost points and then calculate the average the two values.
Find the average of the two centermost values.
The median of the even valued set is four.
Step 3: Upper and lower medians
Once we have found the median of the entire set, we can find the medians of the upper and lower portions of the data. If the data set has an odd number of values, we will omit the median or centermost value of the set. Afterwards, we will find the individual medians for the upper and lower portions of the data.
Omit the centermost value.
Find the median of the lower portion.
Calculate the average of the two values.
The median of the lower portion is
Find the median of the upper portion.
Calculate the average of the two values.
The median of the upper potion is
If the data set has an even number of values, we will use the two values used to calculate the original median to divide the data set. These values are not omitted and become the largest value of the lower data set and the lowest values of the upper data set, respectively. Afterwards, we will calculate the medians of both the upper and lower portions.
Find the median of the lower portion.
The median of the lower portion is two.
Find the median of the upper portion.
The median of the upper portion is eight.
Step 4: Calculate the difference
Last, we need to calculate the difference of the upper and lower medians by subtracting the lower median from the upper median. This value equals the IQR.
Let's find the IQR of the odd data set.
Finally, we will find the IQR of the even data set.
In order to better illustrate these values, their positions in a box plot have been labeled in the provided image.
Now that we have solved a few examples, let's use this knowledge to solve the given problem.
Solution:
To find the IQR, we must first find the
The
thus the
thus the
So,
Compare your answer with the correct one above

Find the interquartile range of the data set above.
Find the interquartile range of the data set above.
How do you find the interquartile range?
We can find the interquartile range or IQR in four simple steps:
- Order the data from least to greatest
- Find the median
- Calculate the median of both the lower and upper half of the data
- The IQR is the difference between the upper and lower medians
Step 1: Order the data
In order to calculate the IQR, we need to begin by ordering the values of the data set from the least to the greatest. Likewise, in order to calculate the median, we need to arrange the numbers in ascending order (i.e. from the least to the greatest).
Let's sort an example data set with an odd number of values into ascending order.
Now, let's perform this task with another example data set that is comprised of an even number of values.
Rearrange into ascending order.
Step 2: Calculate the median
Next, we need to calculate the median. The median is the "center" of the data. If the data set has an odd number of data points, then the mean is the centermost number. On the other hand, if the data set has an even number of values, then we will need to take the arithmetic average of the two centermost values. We will calculate this average by adding the two numbers together and then dividing that number by two.
First, we will find the median of a set with an odd number of values. Cross out values until you find the centermost point
The median of the odd valued data set is four.
Now, let's find the mean of the data set with an even number of values. Cross out values until you find the two centermost points and then calculate the average the two values.
Find the average of the two centermost values.
The median of the even valued set is four.
Step 3: Upper and lower medians
Once we have found the median of the entire set, we can find the medians of the upper and lower portions of the data. If the data set has an odd number of values, we will omit the median or centermost value of the set. Afterwards, we will find the individual medians for the upper and lower portions of the data.
Omit the centermost value.
Find the median of the lower portion.
Calculate the average of the two values.
The median of the lower portion is
Find the median of the upper portion.
Calculate the average of the two values.
The median of the upper potion is
If the data set has an even number of values, we will use the two values used to calculate the original median to divide the data set. These values are not omitted and become the largest value of the lower data set and the lowest values of the upper data set, respectively. Afterwards, we will calculate the medians of both the upper and lower portions.
Find the median of the lower portion.
The median of the lower portion is two.
Find the median of the upper portion.
The median of the upper portion is eight.
Step 4: Calculate the difference
Last, we need to calculate the difference of the upper and lower medians by subtracting the lower median from the upper median. This value equals the IQR.
Let's find the IQR of the odd data set.
Finally, we will find the IQR of the even data set.
In order to better illustrate these values, their positions in a box plot have been labeled in the provided image.
Now that we have solved a few examples, let's use this knowledge to solve the given problem.
Solution:
When asked to find the IQR of a set of data, we must first put the numbers in numerical order:
 .
.
Now we need to divide the data set into the upper quartile and lower quartile, we do so by finding the mean which is the center value of the data set.
In this data set, our median is  .
.
This means that our upper quartile consists of  .
.
So our  =
= , the median of the upper quartile.
Our  =
=  , given that its the median of the lower quartile.
Thus, our IQR is  .
.
How do you find the interquartile range?
We can find the interquartile range or IQR in four simple steps:
- Order the data from least to greatest
- Find the median
- Calculate the median of both the lower and upper half of the data
- The IQR is the difference between the upper and lower medians
Step 1: Order the data
In order to calculate the IQR, we need to begin by ordering the values of the data set from the least to the greatest. Likewise, in order to calculate the median, we need to arrange the numbers in ascending order (i.e. from the least to the greatest).
Let's sort an example data set with an odd number of values into ascending order.
Now, let's perform this task with another example data set that is comprised of an even number of values.
Rearrange into ascending order.
Step 2: Calculate the median
Next, we need to calculate the median. The median is the "center" of the data. If the data set has an odd number of data points, then the mean is the centermost number. On the other hand, if the data set has an even number of values, then we will need to take the arithmetic average of the two centermost values. We will calculate this average by adding the two numbers together and then dividing that number by two.
First, we will find the median of a set with an odd number of values. Cross out values until you find the centermost point
The median of the odd valued data set is four.
Now, let's find the mean of the data set with an even number of values. Cross out values until you find the two centermost points and then calculate the average the two values.
Find the average of the two centermost values.
The median of the even valued set is four.
Step 3: Upper and lower medians
Once we have found the median of the entire set, we can find the medians of the upper and lower portions of the data. If the data set has an odd number of values, we will omit the median or centermost value of the set. Afterwards, we will find the individual medians for the upper and lower portions of the data.
Omit the centermost value.
Find the median of the lower portion.
Calculate the average of the two values.
The median of the lower portion is
Find the median of the upper portion.
Calculate the average of the two values.
The median of the upper potion is
If the data set has an even number of values, we will use the two values used to calculate the original median to divide the data set. These values are not omitted and become the largest value of the lower data set and the lowest values of the upper data set, respectively. Afterwards, we will calculate the medians of both the upper and lower portions.
Find the median of the lower portion.
The median of the lower portion is two.
Find the median of the upper portion.
The median of the upper portion is eight.
Step 4: Calculate the difference
Last, we need to calculate the difference of the upper and lower medians by subtracting the lower median from the upper median. This value equals the IQR.
Let's find the IQR of the odd data set.
Finally, we will find the IQR of the even data set.
In order to better illustrate these values, their positions in a box plot have been labeled in the provided image.
Now that we have solved a few examples, let's use this knowledge to solve the given problem.
Solution:
When asked to find the IQR of a set of data, we must first put the numbers in numerical order:
Now we need to divide the data set into the upper quartile and lower quartile, we do so by finding the mean which is the center value of the data set.
In this data set, our median is
This means that our upper quartile consists of
So our
Our
Thus, our IQR is
Compare your answer with the correct one above

Find the interquartile range given the data set above.
Find the interquartile range given the data set above.
How do you find the interquartile range?
We can find the interquartile range or IQR in four simple steps:
- Order the data from least to greatest
- Find the median
- Calculate the median of both the lower and upper half of the data
- The IQR is the difference between the upper and lower medians
Step 1: Order the data
In order to calculate the IQR, we need to begin by ordering the values of the data set from the least to the greatest. Likewise, in order to calculate the median, we need to arrange the numbers in ascending order (i.e. from the least to the greatest).
Let's sort an example data set with an odd number of values into ascending order.
Now, let's perform this task with another example data set that is comprised of an even number of values.
Rearrange into ascending order.
Step 2: Calculate the median
Next, we need to calculate the median. The median is the "center" of the data. If the data set has an odd number of data points, then the mean is the centermost number. On the other hand, if the data set has an even number of values, then we will need to take the arithmetic average of the two centermost values. We will calculate this average by adding the two numbers together and then dividing that number by two.
First, we will find the median of a set with an odd number of values. Cross out values until you find the centermost point
The median of the odd valued data set is four.
Now, let's find the mean of the data set with an even number of values. Cross out values until you find the two centermost points and then calculate the average the two values.
Find the average of the two centermost values.
The median of the even valued set is four.
Step 3: Upper and lower medians
Once we have found the median of the entire set, we can find the medians of the upper and lower portions of the data. If the data set has an odd number of values, we will omit the median or centermost value of the set. Afterwards, we will find the individual medians for the upper and lower portions of the data.
Omit the centermost value.
Find the median of the lower portion.
Calculate the average of the two values.
The median of the lower portion is
Find the median of the upper portion.
Calculate the average of the two values.
The median of the upper potion is
If the data set has an even number of values, we will use the two values used to calculate the original median to divide the data set. These values are not omitted and become the largest value of the lower data set and the lowest values of the upper data set, respectively. Afterwards, we will calculate the medians of both the upper and lower portions.
Find the median of the lower portion.
The median of the lower portion is two.
Find the median of the upper portion.
The median of the upper portion is eight.
Step 4: Calculate the difference
Last, we need to calculate the difference of the upper and lower medians by subtracting the lower median from the upper median. This value equals the IQR.
Let's find the IQR of the odd data set.
Finally, we will find the IQR of the even data set.
In order to better illustrate these values, their positions in a box plot have been labeled in the provided image.
Now that we have solved a few examples, let's use this knowledge to solve the given problem.
Solution:
When asked to find the IQR of a set of data, we must first put the numbers in numerical order:
 .
.
Now we need to divide the data set into the upper quartile and lower quartile, we do so by finding the median which is the center value of the data set.
In this data set, our median is  .
.
This means that our upper quartile consists of  .
.
So our  =
= , the median of the upper quartile.
Our  =
=  , given that its the median of the lower quartile.
Thus, our IQR is  .
.
How do you find the interquartile range?
We can find the interquartile range or IQR in four simple steps:
- Order the data from least to greatest
- Find the median
- Calculate the median of both the lower and upper half of the data
- The IQR is the difference between the upper and lower medians
Step 1: Order the data
In order to calculate the IQR, we need to begin by ordering the values of the data set from the least to the greatest. Likewise, in order to calculate the median, we need to arrange the numbers in ascending order (i.e. from the least to the greatest).
Let's sort an example data set with an odd number of values into ascending order.
Now, let's perform this task with another example data set that is comprised of an even number of values.
Rearrange into ascending order.
Step 2: Calculate the median
Next, we need to calculate the median. The median is the "center" of the data. If the data set has an odd number of data points, then the mean is the centermost number. On the other hand, if the data set has an even number of values, then we will need to take the arithmetic average of the two centermost values. We will calculate this average by adding the two numbers together and then dividing that number by two.
First, we will find the median of a set with an odd number of values. Cross out values until you find the centermost point
The median of the odd valued data set is four.
Now, let's find the mean of the data set with an even number of values. Cross out values until you find the two centermost points and then calculate the average the two values.
Find the average of the two centermost values.
The median of the even valued set is four.
Step 3: Upper and lower medians
Once we have found the median of the entire set, we can find the medians of the upper and lower portions of the data. If the data set has an odd number of values, we will omit the median or centermost value of the set. Afterwards, we will find the individual medians for the upper and lower portions of the data.
Omit the centermost value.
Find the median of the lower portion.
Calculate the average of the two values.
The median of the lower portion is
Find the median of the upper portion.
Calculate the average of the two values.
The median of the upper potion is
If the data set has an even number of values, we will use the two values used to calculate the original median to divide the data set. These values are not omitted and become the largest value of the lower data set and the lowest values of the upper data set, respectively. Afterwards, we will calculate the medians of both the upper and lower portions.
Find the median of the lower portion.
The median of the lower portion is two.
Find the median of the upper portion.
The median of the upper portion is eight.
Step 4: Calculate the difference
Last, we need to calculate the difference of the upper and lower medians by subtracting the lower median from the upper median. This value equals the IQR.
Let's find the IQR of the odd data set.
Finally, we will find the IQR of the even data set.
In order to better illustrate these values, their positions in a box plot have been labeled in the provided image.
Now that we have solved a few examples, let's use this knowledge to solve the given problem.
Solution:
When asked to find the IQR of a set of data, we must first put the numbers in numerical order:
Now we need to divide the data set into the upper quartile and lower quartile, we do so by finding the median which is the center value of the data set.
In this data set, our median is
This means that our upper quartile consists of
So our
Our
Thus, our IQR is
Compare your answer with the correct one above

Using the data set above, find the interquartile range.
Using the data set above, find the interquartile range.
How do you find the interquartile range?
We can find the interquartile range or IQR in four simple steps:
- Order the data from least to greatest
- Find the median
- Calculate the median of both the lower and upper half of the data
- The IQR is the difference between the upper and lower medians
Step 1: Order the data
In order to calculate the IQR, we need to begin by ordering the values of the data set from the least to the greatest. Likewise, in order to calculate the median, we need to arrange the numbers in ascending order (i.e. from the least to the greatest).
Let's sort an example data set with an odd number of values into ascending order.
Now, let's perform this task with another example data set that is comprised of an even number of values.
Rearrange into ascending order.
Step 2: Calculate the median
Next, we need to calculate the median. The median is the "center" of the data. If the data set has an odd number of data points, then the mean is the centermost number. On the other hand, if the data set has an even number of values, then we will need to take the arithmetic average of the two centermost values. We will calculate this average by adding the two numbers together and then dividing that number by two.
First, we will find the median of a set with an odd number of values. Cross out values until you find the centermost point
The median of the odd valued data set is four.
Now, let's find the mean of the data set with an even number of values. Cross out values until you find the two centermost points and then calculate the average the two values.
Find the average of the two centermost values.
The median of the even valued set is four.
Step 3: Upper and lower medians
Once we have found the median of the entire set, we can find the medians of the upper and lower portions of the data. If the data set has an odd number of values, we will omit the median or centermost value of the set. Afterwards, we will find the individual medians for the upper and lower portions of the data.
Omit the centermost value.
Find the median of the lower portion.
Calculate the average of the two values.
The median of the lower portion is
Find the median of the upper portion.
Calculate the average of the two values.
The median of the upper potion is
If the data set has an even number of values, we will use the two values used to calculate the original median to divide the data set. These values are not omitted and become the largest value of the lower data set and the lowest values of the upper data set, respectively. Afterwards, we will calculate the medians of both the upper and lower portions.
Find the median of the lower portion.
The median of the lower portion is two.
Find the median of the upper portion.
The median of the upper portion is eight.
Step 4: Calculate the difference
Last, we need to calculate the difference of the upper and lower medians by subtracting the lower median from the upper median. This value equals the IQR.
Let's find the IQR of the odd data set.
Finally, we will find the IQR of the even data set.
In order to better illustrate these values, their positions in a box plot have been labeled in the provided image.
Now that we have solved a few examples, let's use this knowledge to solve the given problem.
Solution:
When asked to find the IQR of a set of data, we must first put the numbers in numerical order:
 .
.
Now we need to divide the data set into the upper quartile and lower quartile, we do so by finding the median which is the center value of the data set.
In this data set, our median is  .
.
This means that our upper quartile consists of  .
.
So our  =
= , the median of the upper quartile.
Our  =
=  , given that its the median of the lower quartile.
Thus, our IQR is  .
.
How do you find the interquartile range?
We can find the interquartile range or IQR in four simple steps:
- Order the data from least to greatest
- Find the median
- Calculate the median of both the lower and upper half of the data
- The IQR is the difference between the upper and lower medians
Step 1: Order the data
In order to calculate the IQR, we need to begin by ordering the values of the data set from the least to the greatest. Likewise, in order to calculate the median, we need to arrange the numbers in ascending order (i.e. from the least to the greatest).
Let's sort an example data set with an odd number of values into ascending order.
Now, let's perform this task with another example data set that is comprised of an even number of values.
Rearrange into ascending order.
Step 2: Calculate the median
Next, we need to calculate the median. The median is the "center" of the data. If the data set has an odd number of data points, then the mean is the centermost number. On the other hand, if the data set has an even number of values, then we will need to take the arithmetic average of the two centermost values. We will calculate this average by adding the two numbers together and then dividing that number by two.
First, we will find the median of a set with an odd number of values. Cross out values until you find the centermost point
The median of the odd valued data set is four.
Now, let's find the mean of the data set with an even number of values. Cross out values until you find the two centermost points and then calculate the average the two values.
Find the average of the two centermost values.
The median of the even valued set is four.
Step 3: Upper and lower medians
Once we have found the median of the entire set, we can find the medians of the upper and lower portions of the data. If the data set has an odd number of values, we will omit the median or centermost value of the set. Afterwards, we will find the individual medians for the upper and lower portions of the data.
Omit the centermost value.
Find the median of the lower portion.
Calculate the average of the two values.
The median of the lower portion is
Find the median of the upper portion.
Calculate the average of the two values.
The median of the upper potion is
If the data set has an even number of values, we will use the two values used to calculate the original median to divide the data set. These values are not omitted and become the largest value of the lower data set and the lowest values of the upper data set, respectively. Afterwards, we will calculate the medians of both the upper and lower portions.
Find the median of the lower portion.
The median of the lower portion is two.
Find the median of the upper portion.
The median of the upper portion is eight.
Step 4: Calculate the difference
Last, we need to calculate the difference of the upper and lower medians by subtracting the lower median from the upper median. This value equals the IQR.
Let's find the IQR of the odd data set.
Finally, we will find the IQR of the even data set.
In order to better illustrate these values, their positions in a box plot have been labeled in the provided image.
Now that we have solved a few examples, let's use this knowledge to solve the given problem.
Solution:
When asked to find the IQR of a set of data, we must first put the numbers in numerical order:
Now we need to divide the data set into the upper quartile and lower quartile, we do so by finding the median which is the center value of the data set.
In this data set, our median is
This means that our upper quartile consists of
So our
Our
Thus, our IQR is
Compare your answer with the correct one above
Find the interquartile range.

Find the interquartile range.
How do you find the interquartile range?
We can find the interquartile range or IQR in four simple steps:
- Order the data from least to greatest
- Find the median
- Calculate the median of both the lower and upper half of the data
- The IQR is the difference between the upper and lower medians
Step 1: Order the data
In order to calculate the IQR, we need to begin by ordering the values of the data set from the least to the greatest. Likewise, in order to calculate the median, we need to arrange the numbers in ascending order (i.e. from the least to the greatest).
Let's sort an example data set with an odd number of values into ascending order.
Now, let's perform this task with another example data set that is comprised of an even number of values.
Rearrange into ascending order.
Step 2: Calculate the median
Next, we need to calculate the median. The median is the "center" of the data. If the data set has an odd number of data points, then the mean is the centermost number. On the other hand, if the data set has an even number of values, then we will need to take the arithmetic average of the two centermost values. We will calculate this average by adding the two numbers together and then dividing that number by two.
First, we will find the median of a set with an odd number of values. Cross out values until you find the centermost point
The median of the odd valued data set is four.
Now, let's find the mean of the data set with an even number of values. Cross out values until you find the two centermost points and then calculate the average the two values.
Find the average of the two centermost values.
The median of the even valued set is four.
Step 3: Upper and lower medians
Once we have found the median of the entire set, we can find the medians of the upper and lower portions of the data. If the data set has an odd number of values, we will omit the median or centermost value of the set. Afterwards, we will find the individual medians for the upper and lower portions of the data.
Omit the centermost value.
Find the median of the lower portion.
Calculate the average of the two values.
The median of the lower portion is
Find the median of the upper portion.
Calculate the average of the two values.
The median of the upper potion is
If the data set has an even number of values, we will use the two values used to calculate the original median to divide the data set. These values are not omitted and become the largest value of the lower data set and the lowest values of the upper data set, respectively. Afterwards, we will calculate the medians of both the upper and lower portions.
Find the median of the lower portion.
The median of the lower portion is two.
Find the median of the upper portion.
The median of the upper portion is eight.
Step 4: Calculate the difference
Last, we need to calculate the difference of the upper and lower medians by subtracting the lower median from the upper median. This value equals the IQR.
Let's find the IQR of the odd data set.
Finally, we will find the IQR of the even data set.
In order to better illustrate these values, their positions in a box plot have been labeled in the provided image.
Now that we have solved a few examples, let's use this knowledge to solve the given problem.
Solution:
To find the interquartile range, we need to find the upper and lower quartiles and take the difference. First, let's find the median or  . Since there are eight numbers, we take the average of the two middle numbers which are
  . This number is going to be
  . Next, we find the middle number right and left of
  .
.  is the upper quartile since the middle number in the
  data set on the right is the average of
  .
.  is the lower quartile since the middle number in the
  data set on the left is the average of
  . Now, we find the difference of the two numbers
  which is
  .
.
How do you find the interquartile range?
We can find the interquartile range or IQR in four simple steps:
- Order the data from least to greatest
- Find the median
- Calculate the median of both the lower and upper half of the data
- The IQR is the difference between the upper and lower medians
Step 1: Order the data
In order to calculate the IQR, we need to begin by ordering the values of the data set from the least to the greatest. Likewise, in order to calculate the median, we need to arrange the numbers in ascending order (i.e. from the least to the greatest).
Let's sort an example data set with an odd number of values into ascending order.
Now, let's perform this task with another example data set that is comprised of an even number of values.
Rearrange into ascending order.
Step 2: Calculate the median
Next, we need to calculate the median. The median is the "center" of the data. If the data set has an odd number of data points, then the mean is the centermost number. On the other hand, if the data set has an even number of values, then we will need to take the arithmetic average of the two centermost values. We will calculate this average by adding the two numbers together and then dividing that number by two.
First, we will find the median of a set with an odd number of values. Cross out values until you find the centermost point
The median of the odd valued data set is four.
Now, let's find the mean of the data set with an even number of values. Cross out values until you find the two centermost points and then calculate the average the two values.
Find the average of the two centermost values.
The median of the even valued set is four.
Step 3: Upper and lower medians
Once we have found the median of the entire set, we can find the medians of the upper and lower portions of the data. If the data set has an odd number of values, we will omit the median or centermost value of the set. Afterwards, we will find the individual medians for the upper and lower portions of the data.
Omit the centermost value.
Find the median of the lower portion.
Calculate the average of the two values.
The median of the lower portion is
Find the median of the upper portion.
Calculate the average of the two values.
The median of the upper potion is
If the data set has an even number of values, we will use the two values used to calculate the original median to divide the data set. These values are not omitted and become the largest value of the lower data set and the lowest values of the upper data set, respectively. Afterwards, we will calculate the medians of both the upper and lower portions.
Find the median of the lower portion.
The median of the lower portion is two.
Find the median of the upper portion.
The median of the upper portion is eight.
Step 4: Calculate the difference
Last, we need to calculate the difference of the upper and lower medians by subtracting the lower median from the upper median. This value equals the IQR.
Let's find the IQR of the odd data set.
Finally, we will find the IQR of the even data set.
In order to better illustrate these values, their positions in a box plot have been labeled in the provided image.
Now that we have solved a few examples, let's use this knowledge to solve the given problem.
Solution:
To find the interquartile range, we need to find the upper and lower quartiles and take the difference. First, let's find the median or
Compare your answer with the correct one above
Find the median of the set:

Find the median of the set:
The median is the middle number of the set, when it is listed in order from smallest to largest or vice versa. In this case we have an even amount of numbers in the set meaning there are two "middle numbers"- 22 and 23. In order to find the median we take the average of 22 and 23:

The median is the middle number of the set, when it is listed in order from smallest to largest or vice versa. In this case we have an even amount of numbers in the set meaning there are two "middle numbers"- 22 and 23. In order to find the median we take the average of 22 and 23:
Compare your answer with the correct one above
Find the interquartile range of the following set of numbers:

Find the interquartile range of the following set of numbers:
How do you find the interquartile range?
We can find the interquartile range or IQR in four simple steps:
- Order the data from least to greatest
- Find the median
- Calculate the median of both the lower and upper half of the data
- The IQR is the difference between the upper and lower medians
Step 1: Order the data
In order to calculate the IQR, we need to begin by ordering the values of the data set from the least to the greatest. Likewise, in order to calculate the median, we need to arrange the numbers in ascending order (i.e. from the least to the greatest).
Let's sort an example data set with an odd number of values into ascending order.
Now, let's perform this task with another example data set that is comprised of an even number of values.
Rearrange into ascending order.
Step 2: Calculate the median
Next, we need to calculate the median. The median is the "center" of the data. If the data set has an odd number of data points, then the mean is the centermost number. On the other hand, if the data set has an even number of values, then we will need to take the arithmetic average of the two centermost values. We will calculate this average by adding the two numbers together and then dividing that number by two.
First, we will find the median of a set with an odd number of values. Cross out values until you find the centermost point
The median of the odd valued data set is four.
Now, let's find the mean of the data set with an even number of values. Cross out values until you find the two centermost points and then calculate the average the two values.
Find the average of the two centermost values.
The median of the even valued set is four.
Step 3: Upper and lower medians
Once we have found the median of the entire set, we can find the medians of the upper and lower portions of the data. If the data set has an odd number of values, we will omit the median or centermost value of the set. Afterwards, we will find the individual medians for the upper and lower portions of the data.
Omit the centermost value.
Find the median of the lower portion.
Calculate the average of the two values.
The median of the lower portion is
Find the median of the upper portion.
Calculate the average of the two values.
The median of the upper potion is
If the data set has an even number of values, we will use the two values used to calculate the original median to divide the data set. These values are not omitted and become the largest value of the lower data set and the lowest values of the upper data set, respectively. Afterwards, we will calculate the medians of both the upper and lower portions.
Find the median of the lower portion.
The median of the lower portion is two.
Find the median of the upper portion.
The median of the upper portion is eight.
Step 4: Calculate the difference
Last, we need to calculate the difference of the upper and lower medians by subtracting the lower median from the upper median. This value equals the IQR.
Let's find the IQR of the odd data set.
Finally, we will find the IQR of the even data set.
In order to better illustrate these values, their positions in a box plot have been labeled in the provided image.
Now that we have solved a few examples, let's use this knowledge to solve the given problem.
Solution:
To find quartile range, you first need to isolate the numbers that are the book ends of your first and 3rd quartiles. To do this, find the middlenumber between the min and mean, and subtract this from the middle number between the mean and the max number. Thus,
Compare your answer with the correct one above
Find the interquartile range of the following number set:

Find the interquartile range of the following number set:
How do you find the interquartile range?
We can find the interquartile range or IQR in four simple steps:
- Order the data from least to greatest
- Find the median
- Calculate the median of both the lower and upper half of the data
- The IQR is the difference between the upper and lower medians
Step 1: Order the data
In order to calculate the IQR, we need to begin by ordering the values of the data set from the least to the greatest. Likewise, in order to calculate the median, we need to arrange the numbers in ascending order (i.e. from the least to the greatest).
Let's sort an example data set with an odd number of values into ascending order.
Now, let's perform this task with another example data set that is comprised of an even number of values.
Rearrange into ascending order.
Step 2: Calculate the median
Next, we need to calculate the median. The median is the "center" of the data. If the data set has an odd number of data points, then the mean is the centermost number. On the other hand, if the data set has an even number of values, then we will need to take the arithmetic average of the two centermost values. We will calculate this average by adding the two numbers together and then dividing that number by two.
First, we will find the median of a set with an odd number of values. Cross out values until you find the centermost point
The median of the odd valued data set is four.
Now, let's find the mean of the data set with an even number of values. Cross out values until you find the two centermost points and then calculate the average the two values.
Find the average of the two centermost values.
The median of the even valued set is four.
Step 3: Upper and lower medians
Once we have found the median of the entire set, we can find the medians of the upper and lower portions of the data. If the data set has an odd number of values, we will omit the median or centermost value of the set. Afterwards, we will find the individual medians for the upper and lower portions of the data.
Omit the centermost value.
Find the median of the lower portion.
Calculate the average of the two values.
The median of the lower portion is
Find the median of the upper portion.
Calculate the average of the two values.
The median of the upper potion is
If the data set has an even number of values, we will use the two values used to calculate the original median to divide the data set. These values are not omitted and become the largest value of the lower data set and the lowest values of the upper data set, respectively. Afterwards, we will calculate the medians of both the upper and lower portions.
Find the median of the lower portion.
The median of the lower portion is two.
Find the median of the upper portion.
The median of the upper portion is eight.
Step 4: Calculate the difference
Last, we need to calculate the difference of the upper and lower medians by subtracting the lower median from the upper median. This value equals the IQR.
Let's find the IQR of the odd data set.
Finally, we will find the IQR of the even data set.
In order to better illustrate these values, their positions in a box plot have been labeled in the provided image.
Now that we have solved a few examples, let's use this knowledge to solve the given problem.
Solution:
Find the interquartile range of the following number set:

To find the interquartile range we must first arrange the terms in increasing order.

Now, to find the interquartile range, we need to find the median

Because 97 is the middle value, it is our median.
Next, we need to find quartile 1 and quartile 2. These are sort of like the medians of each half of our data set.
Because we have six terms in each half, we will need to average the two middle terms.


Next, find the interquartile range by finding the following:

So our interquartile range is 284
How do you find the interquartile range?
We can find the interquartile range or IQR in four simple steps:
- Order the data from least to greatest
- Find the median
- Calculate the median of both the lower and upper half of the data
- The IQR is the difference between the upper and lower medians
Step 1: Order the data
In order to calculate the IQR, we need to begin by ordering the values of the data set from the least to the greatest. Likewise, in order to calculate the median, we need to arrange the numbers in ascending order (i.e. from the least to the greatest).
Let's sort an example data set with an odd number of values into ascending order.
Now, let's perform this task with another example data set that is comprised of an even number of values.
Rearrange into ascending order.
Step 2: Calculate the median
Next, we need to calculate the median. The median is the "center" of the data. If the data set has an odd number of data points, then the mean is the centermost number. On the other hand, if the data set has an even number of values, then we will need to take the arithmetic average of the two centermost values. We will calculate this average by adding the two numbers together and then dividing that number by two.
First, we will find the median of a set with an odd number of values. Cross out values until you find the centermost point
The median of the odd valued data set is four.
Now, let's find the mean of the data set with an even number of values. Cross out values until you find the two centermost points and then calculate the average the two values.
Find the average of the two centermost values.
The median of the even valued set is four.
Step 3: Upper and lower medians
Once we have found the median of the entire set, we can find the medians of the upper and lower portions of the data. If the data set has an odd number of values, we will omit the median or centermost value of the set. Afterwards, we will find the individual medians for the upper and lower portions of the data.
Omit the centermost value.
Find the median of the lower portion.
Calculate the average of the two values.
The median of the lower portion is
Find the median of the upper portion.
Calculate the average of the two values.
The median of the upper potion is
If the data set has an even number of values, we will use the two values used to calculate the original median to divide the data set. These values are not omitted and become the largest value of the lower data set and the lowest values of the upper data set, respectively. Afterwards, we will calculate the medians of both the upper and lower portions.
Find the median of the lower portion.
The median of the lower portion is two.
Find the median of the upper portion.
The median of the upper portion is eight.
Step 4: Calculate the difference
Last, we need to calculate the difference of the upper and lower medians by subtracting the lower median from the upper median. This value equals the IQR.
Let's find the IQR of the odd data set.
Finally, we will find the IQR of the even data set.
In order to better illustrate these values, their positions in a box plot have been labeled in the provided image.
Now that we have solved a few examples, let's use this knowledge to solve the given problem.
Solution:
Find the interquartile range of the following number set:
To find the interquartile range we must first arrange the terms in increasing order.
Now, to find the interquartile range, we need to find the median
Because 97 is the middle value, it is our median.
Next, we need to find quartile 1 and quartile 2. These are sort of like the medians of each half of our data set.
Because we have six terms in each half, we will need to average the two middle terms.
Next, find the interquartile range by finding the following:
So our interquartile range is 284
Compare your answer with the correct one above
Find the interquartile range of the data set: 
Find the interquartile range of the data set:
How do you find the interquartile range?
We can find the interquartile range or IQR in four simple steps:
- Order the data from least to greatest
- Find the median
- Calculate the median of both the lower and upper half of the data
- The IQR is the difference between the upper and lower medians
Step 1: Order the data
In order to calculate the IQR, we need to begin by ordering the values of the data set from the least to the greatest. Likewise, in order to calculate the median, we need to arrange the numbers in ascending order (i.e. from the least to the greatest).
Let's sort an example data set with an odd number of values into ascending order.
Now, let's perform this task with another example data set that is comprised of an even number of values.
Rearrange into ascending order.
Step 2: Calculate the median
Next, we need to calculate the median. The median is the "center" of the data. If the data set has an odd number of data points, then the mean is the centermost number. On the other hand, if the data set has an even number of values, then we will need to take the arithmetic average of the two centermost values. We will calculate this average by adding the two numbers together and then dividing that number by two.
First, we will find the median of a set with an odd number of values. Cross out values until you find the centermost point
The median of the odd valued data set is four.
Now, let's find the mean of the data set with an even number of values. Cross out values until you find the two centermost points and then calculate the average the two values.
Find the average of the two centermost values.
The median of the even valued set is four.
Step 3: Upper and lower medians
Once we have found the median of the entire set, we can find the medians of the upper and lower portions of the data. If the data set has an odd number of values, we will omit the median or centermost value of the set. Afterwards, we will find the individual medians for the upper and lower portions of the data.
Omit the centermost value.
Find the median of the lower portion.
Calculate the average of the two values.
The median of the lower portion is
Find the median of the upper portion.
Calculate the average of the two values.
The median of the upper potion is
If the data set has an even number of values, we will use the two values used to calculate the original median to divide the data set. These values are not omitted and become the largest value of the lower data set and the lowest values of the upper data set, respectively. Afterwards, we will calculate the medians of both the upper and lower portions.
Find the median of the lower portion.
The median of the lower portion is two.
Find the median of the upper portion.
The median of the upper portion is eight.
Step 4: Calculate the difference
Last, we need to calculate the difference of the upper and lower medians by subtracting the lower median from the upper median. This value equals the IQR.
Let's find the IQR of the odd data set.
Finally, we will find the IQR of the even data set.
In order to better illustrate these values, their positions in a box plot have been labeled in the provided image.
Now that we have solved a few examples, let's use this knowledge to solve the given problem.
Solution:
Write the formula for the interquartile range.

Determine the median of the dataset. Since the dataset is already in chronological order, the median is 8.
To the left of the median, there are three numbers 1,3, and 5. The  is the median of those three numbers.
  would be the median of 10, 11, and 12.
Find the medians.


Input the numbers into the equation and solve for the interquartile range.

The answer is  .
.
How do you find the interquartile range?
We can find the interquartile range or IQR in four simple steps:
- Order the data from least to greatest
- Find the median
- Calculate the median of both the lower and upper half of the data
- The IQR is the difference between the upper and lower medians
Step 1: Order the data
In order to calculate the IQR, we need to begin by ordering the values of the data set from the least to the greatest. Likewise, in order to calculate the median, we need to arrange the numbers in ascending order (i.e. from the least to the greatest).
Let's sort an example data set with an odd number of values into ascending order.
Now, let's perform this task with another example data set that is comprised of an even number of values.
Rearrange into ascending order.
Step 2: Calculate the median
Next, we need to calculate the median. The median is the "center" of the data. If the data set has an odd number of data points, then the mean is the centermost number. On the other hand, if the data set has an even number of values, then we will need to take the arithmetic average of the two centermost values. We will calculate this average by adding the two numbers together and then dividing that number by two.
First, we will find the median of a set with an odd number of values. Cross out values until you find the centermost point
The median of the odd valued data set is four.
Now, let's find the mean of the data set with an even number of values. Cross out values until you find the two centermost points and then calculate the average the two values.
Find the average of the two centermost values.
The median of the even valued set is four.
Step 3: Upper and lower medians
Once we have found the median of the entire set, we can find the medians of the upper and lower portions of the data. If the data set has an odd number of values, we will omit the median or centermost value of the set. Afterwards, we will find the individual medians for the upper and lower portions of the data.
Omit the centermost value.
Find the median of the lower portion.
Calculate the average of the two values.
The median of the lower portion is
Find the median of the upper portion.
Calculate the average of the two values.
The median of the upper potion is
If the data set has an even number of values, we will use the two values used to calculate the original median to divide the data set. These values are not omitted and become the largest value of the lower data set and the lowest values of the upper data set, respectively. Afterwards, we will calculate the medians of both the upper and lower portions.
Find the median of the lower portion.
The median of the lower portion is two.
Find the median of the upper portion.
The median of the upper portion is eight.
Step 4: Calculate the difference
Last, we need to calculate the difference of the upper and lower medians by subtracting the lower median from the upper median. This value equals the IQR.
Let's find the IQR of the odd data set.
Finally, we will find the IQR of the even data set.
In order to better illustrate these values, their positions in a box plot have been labeled in the provided image.
Now that we have solved a few examples, let's use this knowledge to solve the given problem.
Solution:
Write the formula for the interquartile range.
Determine the median of the dataset. Since the dataset is already in chronological order, the median is 8.
To the left of the median, there are three numbers 1,3, and 5. The
Find the medians.
Input the numbers into the equation and solve for the interquartile range.
The answer is
Compare your answer with the correct one above
Find the interquartile range of the following set of numbers.

Find the interquartile range of the following set of numbers.
How do you find the interquartile range?
We can find the interquartile range or IQR in four simple steps:
- Order the data from least to greatest
- Find the median
- Calculate the median of both the lower and upper half of the data
- The IQR is the difference between the upper and lower medians
Step 1: Order the data
In order to calculate the IQR, we need to begin by ordering the values of the data set from the least to the greatest. Likewise, in order to calculate the median, we need to arrange the numbers in ascending order (i.e. from the least to the greatest).
Let's sort an example data set with an odd number of values into ascending order.
Now, let's perform this task with another example data set that is comprised of an even number of values.
Rearrange into ascending order.
Step 2: Calculate the median
Next, we need to calculate the median. The median is the "center" of the data. If the data set has an odd number of data points, then the mean is the centermost number. On the other hand, if the data set has an even number of values, then we will need to take the arithmetic average of the two centermost values. We will calculate this average by adding the two numbers together and then dividing that number by two.
First, we will find the median of a set with an odd number of values. Cross out values until you find the centermost point
The median of the odd valued data set is four.
Now, let's find the mean of the data set with an even number of values. Cross out values until you find the two centermost points and then calculate the average the two values.
Find the average of the two centermost values.
The median of the even valued set is four.
Step 3: Upper and lower medians
Once we have found the median of the entire set, we can find the medians of the upper and lower portions of the data. If the data set has an odd number of values, we will omit the median or centermost value of the set. Afterwards, we will find the individual medians for the upper and lower portions of the data.
Omit the centermost value.
Find the median of the lower portion.
Calculate the average of the two values.
The median of the lower portion is
Find the median of the upper portion.
Calculate the average of the two values.
The median of the upper potion is
If the data set has an even number of values, we will use the two values used to calculate the original median to divide the data set. These values are not omitted and become the largest value of the lower data set and the lowest values of the upper data set, respectively. Afterwards, we will calculate the medians of both the upper and lower portions.
Find the median of the lower portion.
The median of the lower portion is two.
Find the median of the upper portion.
The median of the upper portion is eight.
Step 4: Calculate the difference
Last, we need to calculate the difference of the upper and lower medians by subtracting the lower median from the upper median. This value equals the IQR.
Let's find the IQR of the odd data set.
Finally, we will find the IQR of the even data set.
In order to better illustrate these values, their positions in a box plot have been labeled in the provided image.
Now that we have solved a few examples, let's use this knowledge to solve the given problem.
Solution:
To find interquartile range, you must find the range between the first and third quartiles. To do this, you must find the median value in the set of numbers to the left and right of the median. Thus, our first quartile is at  and our third quartile is at
  . Therefore,

How do you find the interquartile range?
We can find the interquartile range or IQR in four simple steps:
- Order the data from least to greatest
- Find the median
- Calculate the median of both the lower and upper half of the data
- The IQR is the difference between the upper and lower medians
Step 1: Order the data
In order to calculate the IQR, we need to begin by ordering the values of the data set from the least to the greatest. Likewise, in order to calculate the median, we need to arrange the numbers in ascending order (i.e. from the least to the greatest).
Let's sort an example data set with an odd number of values into ascending order.
Now, let's perform this task with another example data set that is comprised of an even number of values.
Rearrange into ascending order.
Step 2: Calculate the median
Next, we need to calculate the median. The median is the "center" of the data. If the data set has an odd number of data points, then the mean is the centermost number. On the other hand, if the data set has an even number of values, then we will need to take the arithmetic average of the two centermost values. We will calculate this average by adding the two numbers together and then dividing that number by two.
First, we will find the median of a set with an odd number of values. Cross out values until you find the centermost point
The median of the odd valued data set is four.
Now, let's find the mean of the data set with an even number of values. Cross out values until you find the two centermost points and then calculate the average the two values.
Find the average of the two centermost values.
The median of the even valued set is four.
Step 3: Upper and lower medians
Once we have found the median of the entire set, we can find the medians of the upper and lower portions of the data. If the data set has an odd number of values, we will omit the median or centermost value of the set. Afterwards, we will find the individual medians for the upper and lower portions of the data.
Omit the centermost value.
Find the median of the lower portion.
Calculate the average of the two values.
The median of the lower portion is
Find the median of the upper portion.
Calculate the average of the two values.
The median of the upper potion is
If the data set has an even number of values, we will use the two values used to calculate the original median to divide the data set. These values are not omitted and become the largest value of the lower data set and the lowest values of the upper data set, respectively. Afterwards, we will calculate the medians of both the upper and lower portions.
Find the median of the lower portion.
The median of the lower portion is two.
Find the median of the upper portion.
The median of the upper portion is eight.
Step 4: Calculate the difference
Last, we need to calculate the difference of the upper and lower medians by subtracting the lower median from the upper median. This value equals the IQR.
Let's find the IQR of the odd data set.
Finally, we will find the IQR of the even data set.
In order to better illustrate these values, their positions in a box plot have been labeled in the provided image.
Now that we have solved a few examples, let's use this knowledge to solve the given problem.
Solution:
To find interquartile range, you must find the range between the first and third quartiles. To do this, you must find the median value in the set of numbers to the left and right of the median. Thus, our first quartile is at
Compare your answer with the correct one above
Find the interquartile range of the following data set:

Find the interquartile range of the following data set:
How do you find the interquartile range?
We can find the interquartile range or IQR in four simple steps:
- Order the data from least to greatest
- Find the median
- Calculate the median of both the lower and upper half of the data
- The IQR is the difference between the upper and lower medians
Step 1: Order the data
In order to calculate the IQR, we need to begin by ordering the values of the data set from the least to the greatest. Likewise, in order to calculate the median, we need to arrange the numbers in ascending order (i.e. from the least to the greatest).
Let's sort an example data set with an odd number of values into ascending order.
Now, let's perform this task with another example data set that is comprised of an even number of values.
Rearrange into ascending order.
Step 2: Calculate the median
Next, we need to calculate the median. The median is the "center" of the data. If the data set has an odd number of data points, then the mean is the centermost number. On the other hand, if the data set has an even number of values, then we will need to take the arithmetic average of the two centermost values. We will calculate this average by adding the two numbers together and then dividing that number by two.
First, we will find the median of a set with an odd number of values. Cross out values until you find the centermost point
The median of the odd valued data set is four.
Now, let's find the mean of the data set with an even number of values. Cross out values until you find the two centermost points and then calculate the average the two values.
Find the average of the two centermost values.
The median of the even valued set is four.
Step 3: Upper and lower medians
Once we have found the median of the entire set, we can find the medians of the upper and lower portions of the data. If the data set has an odd number of values, we will omit the median or centermost value of the set. Afterwards, we will find the individual medians for the upper and lower portions of the data.
Omit the centermost value.
Find the median of the lower portion.
Calculate the average of the two values.
The median of the lower portion is
Find the median of the upper portion.
Calculate the average of the two values.
The median of the upper potion is
If the data set has an even number of values, we will use the two values used to calculate the original median to divide the data set. These values are not omitted and become the largest value of the lower data set and the lowest values of the upper data set, respectively. Afterwards, we will calculate the medians of both the upper and lower portions.
Find the median of the lower portion.
The median of the lower portion is two.
Find the median of the upper portion.
The median of the upper portion is eight.
Step 4: Calculate the difference
Last, we need to calculate the difference of the upper and lower medians by subtracting the lower median from the upper median. This value equals the IQR.
Let's find the IQR of the odd data set.
Finally, we will find the IQR of the even data set.
In order to better illustrate these values, their positions in a box plot have been labeled in the provided image.
Now that we have solved a few examples, let's use this knowledge to solve the given problem.
Solution:
Find the median of the following data set:

Whenever we are working with a data set, it can be helpful to put the terms in order:

Now that our terms are in order, we can do all sorts of things with them.
In this case, we need the interquartile range. First let's find the median

In this case, we have an equal number of terms, so we need to find the average of the middle two.

So our median is 39
Next, we need to find the first and third quartiles. These are essentially the medians of each half of our data set.
First Quartile is easy. it is just 16 because our two middle values for the first half are 16:

Third Quartile

finally, our IQR is going to be the difference between our 1st and 3rd quartiles:

So our answer is 64
How do you find the interquartile range?
We can find the interquartile range or IQR in four simple steps:
- Order the data from least to greatest
- Find the median
- Calculate the median of both the lower and upper half of the data
- The IQR is the difference between the upper and lower medians
Step 1: Order the data
In order to calculate the IQR, we need to begin by ordering the values of the data set from the least to the greatest. Likewise, in order to calculate the median, we need to arrange the numbers in ascending order (i.e. from the least to the greatest).
Let's sort an example data set with an odd number of values into ascending order.
Now, let's perform this task with another example data set that is comprised of an even number of values.
Rearrange into ascending order.
Step 2: Calculate the median
Next, we need to calculate the median. The median is the "center" of the data. If the data set has an odd number of data points, then the mean is the centermost number. On the other hand, if the data set has an even number of values, then we will need to take the arithmetic average of the two centermost values. We will calculate this average by adding the two numbers together and then dividing that number by two.
First, we will find the median of a set with an odd number of values. Cross out values until you find the centermost point
The median of the odd valued data set is four.
Now, let's find the mean of the data set with an even number of values. Cross out values until you find the two centermost points and then calculate the average the two values.
Find the average of the two centermost values.
The median of the even valued set is four.
Step 3: Upper and lower medians
Once we have found the median of the entire set, we can find the medians of the upper and lower portions of the data. If the data set has an odd number of values, we will omit the median or centermost value of the set. Afterwards, we will find the individual medians for the upper and lower portions of the data.
Omit the centermost value.
Find the median of the lower portion.
Calculate the average of the two values.
The median of the lower portion is
Find the median of the upper portion.
Calculate the average of the two values.
The median of the upper potion is
If the data set has an even number of values, we will use the two values used to calculate the original median to divide the data set. These values are not omitted and become the largest value of the lower data set and the lowest values of the upper data set, respectively. Afterwards, we will calculate the medians of both the upper and lower portions.
Find the median of the lower portion.
The median of the lower portion is two.
Find the median of the upper portion.
The median of the upper portion is eight.
Step 4: Calculate the difference
Last, we need to calculate the difference of the upper and lower medians by subtracting the lower median from the upper median. This value equals the IQR.
Let's find the IQR of the odd data set.
Finally, we will find the IQR of the even data set.
In order to better illustrate these values, their positions in a box plot have been labeled in the provided image.
Now that we have solved a few examples, let's use this knowledge to solve the given problem.
Solution:
Find the median of the following data set:
Whenever we are working with a data set, it can be helpful to put the terms in order:
Now that our terms are in order, we can do all sorts of things with them.
In this case, we need the interquartile range. First let's find the median
In this case, we have an equal number of terms, so we need to find the average of the middle two.
So our median is 39
Next, we need to find the first and third quartiles. These are essentially the medians of each half of our data set.
First Quartile is easy. it is just 16 because our two middle values for the first half are 16:
Third Quartile
finally, our IQR is going to be the difference between our 1st and 3rd quartiles:
So our answer is 64
Compare your answer with the correct one above
Find the interquartile range of the following set of numbers:
1,1,3,7,7,8,9,12,15
Find the interquartile range of the following set of numbers:
1,1,3,7,7,8,9,12,15
How do you find the interquartile range?
We can find the interquartile range or IQR in four simple steps:
- Order the data from least to greatest
- Find the median
- Calculate the median of both the lower and upper half of the data
- The IQR is the difference between the upper and lower medians
Step 1: Order the data
In order to calculate the IQR, we need to begin by ordering the values of the data set from the least to the greatest. Likewise, in order to calculate the median, we need to arrange the numbers in ascending order (i.e. from the least to the greatest).
Let's sort an example data set with an odd number of values into ascending order.
Now, let's perform this task with another example data set that is comprised of an even number of values.
Rearrange into ascending order.
Step 2: Calculate the median
Next, we need to calculate the median. The median is the "center" of the data. If the data set has an odd number of data points, then the mean is the centermost number. On the other hand, if the data set has an even number of values, then we will need to take the arithmetic average of the two centermost values. We will calculate this average by adding the two numbers together and then dividing that number by two.
First, we will find the median of a set with an odd number of values. Cross out values until you find the centermost point
The median of the odd valued data set is four.
Now, let's find the mean of the data set with an even number of values. Cross out values until you find the two centermost points and then calculate the average the two values.
Find the average of the two centermost values.
The median of the even valued set is four.
Step 3: Upper and lower medians
Once we have found the median of the entire set, we can find the medians of the upper and lower portions of the data. If the data set has an odd number of values, we will omit the median or centermost value of the set. Afterwards, we will find the individual medians for the upper and lower portions of the data.
Omit the centermost value.
Find the median of the lower portion.
Calculate the average of the two values.
The median of the lower portion is
Find the median of the upper portion.
Calculate the average of the two values.
The median of the upper potion is
If the data set has an even number of values, we will use the two values used to calculate the original median to divide the data set. These values are not omitted and become the largest value of the lower data set and the lowest values of the upper data set, respectively. Afterwards, we will calculate the medians of both the upper and lower portions.
Find the median of the lower portion.
The median of the lower portion is two.
Find the median of the upper portion.
The median of the upper portion is eight.
Step 4: Calculate the difference
Last, we need to calculate the difference of the upper and lower medians by subtracting the lower median from the upper median. This value equals the IQR.
Let's find the IQR of the odd data set.
Finally, we will find the IQR of the even data set.
In order to better illustrate these values, their positions in a box plot have been labeled in the provided image.
Now that we have solved a few examples, let's use this knowledge to solve the given problem.
Solution:
To solve, simply find the difference of your first and third quartiles. To find this, you have to find the value half way between the beginning and your median and between you median and the last value. From a prior question we know that the medial is located 5 from either side. Thus, in the middle of 5 we have 3, so our two values are 3 from the beginning and 3 from the end.
Compare your answer with the correct one above
Find the range of the following set:

Find the range of the following set:
To find the range of a set, subtract the smallest number in the set from the largest number in the set

In this case, the smallest number is 91 and the largest number is 6. To solve, subtract these numbers.

To find the range of a set, subtract the smallest number in the set from the largest number in the set
In this case, the smallest number is 91 and the largest number is 6. To solve, subtract these numbers.
Compare your answer with the correct one above
Find the median of the set:

Find the median of the set:
The median is the middle number of the set, when it is listed in order from smallest to largest or vice versa. In this case we have an odd amount of numbers so we just count from each side until we find the number in the middle.

This gives us a final answer of 33 for the median.
The median is the middle number of the set, when it is listed in order from smallest to largest or vice versa. In this case we have an odd amount of numbers so we just count from each side until we find the number in the middle.
This gives us a final answer of 33 for the median.
Compare your answer with the correct one above
Find the median of the set:

Find the median of the set:
The median is the middle number of the set, when it is listed in order from smallest to largest or vice versa. In this case we have an even amount of numbers in the set meaning there are two "middle numbers"- 24 and 26. In order to find the median we take the average of 24 and 26:

The median is the middle number of the set, when it is listed in order from smallest to largest or vice versa. In this case we have an even amount of numbers in the set meaning there are two "middle numbers"- 24 and 26. In order to find the median we take the average of 24 and 26:
Compare your answer with the correct one above

Using the data above, what is the interquartile range?
Using the data above, what is the interquartile range?
How do you find the interquartile range?
We can find the interquartile range or IQR in four simple steps:
- Order the data from least to greatest
- Find the median
- Calculate the median of both the lower and upper half of the data
- The IQR is the difference between the upper and lower medians
Step 1: Order the data
In order to calculate the IQR, we need to begin by ordering the values of the data set from the least to the greatest. Likewise, in order to calculate the median, we need to arrange the numbers in ascending order (i.e. from the least to the greatest).
Let's sort an example data set with an odd number of values into ascending order.
Now, let's perform this task with another example data set that is comprised of an even number of values.
Rearrange into ascending order.
Step 2: Calculate the median
Next, we need to calculate the median. The median is the "center" of the data. If the data set has an odd number of data points, then the mean is the centermost number. On the other hand, if the data set has an even number of values, then we will need to take the arithmetic average of the two centermost values. We will calculate this average by adding the two numbers together and then dividing that number by two.
First, we will find the median of a set with an odd number of values. Cross out values until you find the centermost point
The median of the odd valued data set is four.
Now, let's find the mean of the data set with an even number of values. Cross out values until you find the two centermost points and then calculate the average the two values.
Find the average of the two centermost values.
The median of the even valued set is four.
Step 3: Upper and lower medians
Once we have found the median of the entire set, we can find the medians of the upper and lower portions of the data. If the data set has an odd number of values, we will omit the median or centermost value of the set. Afterwards, we will find the individual medians for the upper and lower portions of the data.
Omit the centermost value.
Find the median of the lower portion.
Calculate the average of the two values.
The median of the lower portion is
Find the median of the upper portion.
Calculate the average of the two values.
The median of the upper potion is
If the data set has an even number of values, we will use the two values used to calculate the original median to divide the data set. These values are not omitted and become the largest value of the lower data set and the lowest values of the upper data set, respectively. Afterwards, we will calculate the medians of both the upper and lower portions.
Find the median of the lower portion.
The median of the lower portion is two.
Find the median of the upper portion.
The median of the upper portion is eight.
Step 4: Calculate the difference
Last, we need to calculate the difference of the upper and lower medians by subtracting the lower median from the upper median. This value equals the IQR.
Let's find the IQR of the odd data set.
Finally, we will find the IQR of the even data set.
In order to better illustrate these values, their positions in a box plot have been labeled in the provided image.
Now that we have solved a few examples, let's use this knowledge to solve the given problem.
Solution:
To find the IQR, we first must find the  and
and  , because
  .
.
In data sets,  is defined as the median of the top half of data and
  is defined as the median of the bottom half of the data.
In a previous problem, we placed the data pieces in numerical order:

and found  to be the median or center of the data:
 .
.
Our upper half of our data set, the numbers above our median, now consists of  . The median, or middle number, of this upper half is
  , our
, our  . The lower half of data, numbers below our median, is
  with
with  being our median,
  .
.
We now have our  and our
  .
.

Thus our  . Note that although we have an outlier of
  , our
, our  . Therefore, we can observe that an outlier's effect on a data set is not very strong when finding the interquartile range.
How do you find the interquartile range?
We can find the interquartile range or IQR in four simple steps:
- Order the data from least to greatest
- Find the median
- Calculate the median of both the lower and upper half of the data
- The IQR is the difference between the upper and lower medians
Step 1: Order the data
In order to calculate the IQR, we need to begin by ordering the values of the data set from the least to the greatest. Likewise, in order to calculate the median, we need to arrange the numbers in ascending order (i.e. from the least to the greatest).
Let's sort an example data set with an odd number of values into ascending order.
Now, let's perform this task with another example data set that is comprised of an even number of values.
Rearrange into ascending order.
Step 2: Calculate the median
Next, we need to calculate the median. The median is the "center" of the data. If the data set has an odd number of data points, then the mean is the centermost number. On the other hand, if the data set has an even number of values, then we will need to take the arithmetic average of the two centermost values. We will calculate this average by adding the two numbers together and then dividing that number by two.
First, we will find the median of a set with an odd number of values. Cross out values until you find the centermost point
The median of the odd valued data set is four.
Now, let's find the mean of the data set with an even number of values. Cross out values until you find the two centermost points and then calculate the average the two values.
Find the average of the two centermost values.
The median of the even valued set is four.
Step 3: Upper and lower medians
Once we have found the median of the entire set, we can find the medians of the upper and lower portions of the data. If the data set has an odd number of values, we will omit the median or centermost value of the set. Afterwards, we will find the individual medians for the upper and lower portions of the data.
Omit the centermost value.
Find the median of the lower portion.
Calculate the average of the two values.
The median of the lower portion is
Find the median of the upper portion.
Calculate the average of the two values.
The median of the upper potion is
If the data set has an even number of values, we will use the two values used to calculate the original median to divide the data set. These values are not omitted and become the largest value of the lower data set and the lowest values of the upper data set, respectively. Afterwards, we will calculate the medians of both the upper and lower portions.
Find the median of the lower portion.
The median of the lower portion is two.
Find the median of the upper portion.
The median of the upper portion is eight.
Step 4: Calculate the difference
Last, we need to calculate the difference of the upper and lower medians by subtracting the lower median from the upper median. This value equals the IQR.
Let's find the IQR of the odd data set.
Finally, we will find the IQR of the even data set.
In order to better illustrate these values, their positions in a box plot have been labeled in the provided image.
Now that we have solved a few examples, let's use this knowledge to solve the given problem.
Solution:
To find the IQR, we first must find the
In data sets,
In a previous problem, we placed the data pieces in numerical order:
and found
Our upper half of our data set, the numbers above our median, now consists of
We now have our
Thus our
Compare your answer with the correct one above
Find the mean of the following set:

Find the mean of the following set:
Another word for mean is average. To find the average of this set of numbers, add them up, then divide by the amount of numbers in the set. In this case there are 5 numbers in the set, meaning we will divide our answer by 5.

Another word for mean is average. To find the average of this set of numbers, add them up, then divide by the amount of numbers in the set. In this case there are 5 numbers in the set, meaning we will divide our answer by 5.
Compare your answer with the correct one above
Tom recieved an 87%, 92%, 77%, and 90% on his 4 exams. Find the mean of these scores.
Tom recieved an 87%, 92%, 77%, and 90% on his 4 exams. Find the mean of these scores.
To find the mean of a certain set of numbers we need to add all enteries together and then divide by how many numbers you have.
In our case we do:


To find the mean of a certain set of numbers we need to add all enteries together and then divide by how many numbers you have.
In our case we do:
Compare your answer with the correct one above
Karen wants to get an average of 92% at the end of the semester in her class. She has 1 test left to take before the semester is over to raise her average. If she recieved an 88%, 87%, 95%, and 93% on her tests what does she need to recieve on her last test to obtain the 92% average?
Karen wants to get an average of 92% at the end of the semester in her class. She has 1 test left to take before the semester is over to raise her average. If she recieved an 88%, 87%, 95%, and 93% on her tests what does she need to recieve on her last test to obtain the 92% average?
For this question we need to set up an equation to find the mean, set it equal to our desired mean of 92 and solve for our missing test value.

From here we perform algebraic procedures to simplify the equation


For this question we need to set up an equation to find the mean, set it equal to our desired mean of 92 and solve for our missing test value.
From here we perform algebraic procedures to simplify the equation
Compare your answer with the correct one above
Clara recieved 10 apples on Monday, 9 apples on Tuesday, and 5 apples on Wednesday. What was the average number of apples she recieved?
Clara recieved 10 apples on Monday, 9 apples on Tuesday, and 5 apples on Wednesday. What was the average number of apples she recieved?
To solve this problem we use the equation to find the mean. We add all entries and then divide by the number of entries we have. It is as follows:


To solve this problem we use the equation to find the mean. We add all entries and then divide by the number of entries we have. It is as follows:
Compare your answer with the correct one above