SAT Math Flashcards: Scatter Plots

Study Scatter Plots in SAT Math with focused flashcards that help you recognize the idea, recall the key rule, and apply it in practice-style prompts.

SAT Math

Scatter Plots

0 mastered0 still learning

0% Complete

QUESTION
1/ 79

What does a positive correlation look like on a scatter plot?

Tap card or press Space to flip

ANSWER

Points trend upwards from left to right. As x increases, y also increases, showing a positive relationship.

How well did you know it?

Card 1 / 79

What this deck covers

This deck focuses on Scatter Plots, giving you a quick way to review the definitions, rules, and examples that matter most for SAT Math.

How to use these flashcards

Work through these flashcards in short sessions. Try to answer each prompt before flipping the card, then revisit any cards you miss until the explanation feels automatic.

All flashcards

Flashcard 1: What does a positive correlation look like on a scatter plot?

Answer: Points trend upwards from left to right. As x increases, y also increases, showing a positive relationship.

Flashcard 2: What does a residual plot show?

Answer: The residuals on the y-axis versus the independent variable. Helps assess whether the linear model fits the data well.

Flashcard 3: Choose the correlation: Slope is negative.

Answer: Negative correlation. Negative slope means variables move in opposite directions.

Flashcard 4: Which type of correlation is suggested by a downward trend in a scatter plot?

Answer: Negative correlation. Downward slope indicates variables move in opposite directions.

Flashcard 5: What is the role of the correlation coefficient?

Answer: To quantify the strength and direction of a relationship. Measures how closely the data follows a linear pattern.

Flashcard 6: What is the primary purpose of a scatter plot?

Answer: To display the relationship between two quantitative variables. Shows how two numerical variables relate or change together.

Flashcard 7: What does each point on a scatter plot represent?

Answer: A pair of values for the two variables being compared. One coordinate from each variable creates a single data point.

Flashcard 8: Find the pattern: Residuals show no clear pattern.

Answer: The model is appropriate for the data. Random residuals suggest the linear model is valid.

Flashcard 9: What does it mean if a scatter plot shows no discernible pattern?

Answer: No correlation. The variables are not related in a predictable way.

Flashcard 10: What does clustering in a scatter plot indicate?

Answer: Groups of data points clustered together. Shows distinct groups or categories within the data set.

Flashcard 11: Find the strength: Correlation coefficient is -0.2.

Answer: Weak negative correlation. 0.2-0.2 is close to 00, indicating a weak relationship.

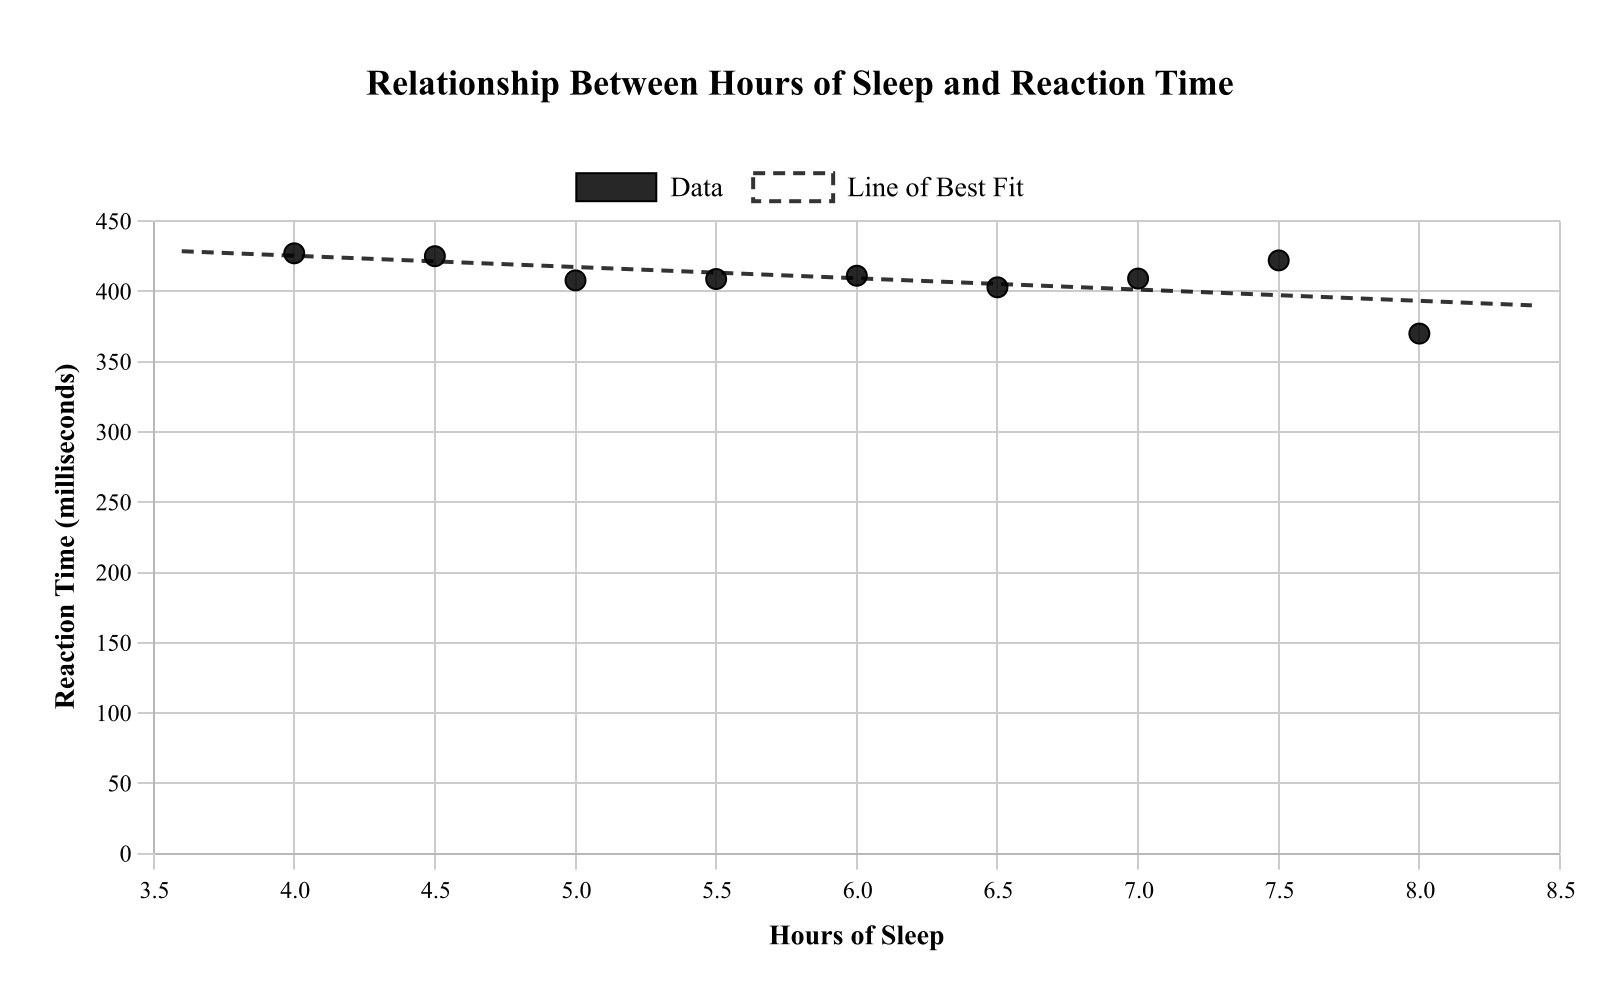
Flashcard 12: What is the line of best fit?

Answer: A straight line that best represents the data on a scatter plot. Also called a trend line, it summarizes the data's relationship.

Flashcard 13: What is a scatter plot used for in data analysis?

Answer: To visualize the relationship between two quantitative variables. Shows how one variable changes as another changes.

Flashcard 14: What does a steep slope indicate in a scatter plot?

Answer: A strong relationship between the variables. Large changes in y correspond to small changes in x.

Flashcard 15: What is the role of the correlation coefficient?

Answer: To quantify the strength and direction of a relationship. Measures how closely the data follows a linear pattern.

Flashcard 16: What does a correlation coefficient of 1 indicate?

Answer: Perfect positive linear relationship. All points lie exactly on an upward-sloping line.

Flashcard 17: Identify the type of prediction: Beyond data range.

Answer: Extrapolation. Predicting outside the data range carries more uncertainty.

Flashcard 18: What does no correlation look like on a scatter plot?

Answer: Points are scattered randomly with no clear trend. No predictable pattern exists between the two variables.

Flashcard 19: Given a scatter plot with no discernible pattern, what is the correlation type?

Answer: No correlation. Random scatter with no clear pattern means variables are unrelated.

Flashcard 20: What is a scatter plot used for in data analysis?

Answer: To visualize the relationship between two quantitative variables. Shows how one variable changes as another changes.

Flashcard 21: Identify the variable type: x-axis in a scatter plot.

Answer: Independent variable. The x-axis variable is controlled or chosen first.

Flashcard 22: Find the strength: Correlation coefficient is 0.85.

Answer: Strong positive correlation. 0.850.85 is close to 11, indicating a strong positive relationship.

Flashcard 23: What information does the slope of the trend line give?

Answer: The rate of change between the variables. Slope shows how much y changes per unit increase in x.

Flashcard 24: What is indicated by outliers in a scatter plot?

Answer: Data points that deviate significantly from the pattern. These unusual points don't follow the overall trend.

Flashcard 25: What does each point on a scatter plot represent?

Answer: A pair of values for the two variables being compared. One coordinate from each variable creates a single data point.

Flashcard 26: What is interpolation in the context of scatter plots?

Answer: Predicting values within the range of the data. Uses the trend line between existing data points.

Flashcard 27: Identify the type of prediction: Within data range.

Answer: Interpolation. Predicting between existing points is generally more reliable.

Flashcard 28: Identify the x-axis on a scatter plot.

Answer: The horizontal axis representing the independent variable. Also called the independent variable because it's controlled or measured first.

Flashcard 29: Identify the variable type: y-axis in a scatter plot.

Answer: Dependent variable. The y-axis variable responds to changes in the x-variable.

Flashcard 30: Find and correct the error: Points tightly clustered indicate weak correlation.

Answer: Correct: indicate strong correlation. Tightly clustered points show strong, not weak correlation.

Flashcard 31: Which term describes a pattern where points form a straight line?

Answer: Linear relationship. Points can be approximated by a straight line.

Flashcard 32: Which term describes a pattern where points form a straight line?

Answer: Linear relationship. Points can be approximated by a straight line.

Flashcard 33: Which type of correlation is suggested by a downward trend in a scatter plot?

Answer: Negative correlation. Downward slope indicates variables move in opposite directions.

Flashcard 34: What is a scatter plot?

Answer: A graph that shows the relationship between two variables using points. Each point plots one x-value against one y-value to visualize patterns.

Flashcard 35: Identify the type of correlation: points slope downward.

Answer: Negative correlation. As one variable increases, the other decreases.

Flashcard 36: Choose the correlation: Slope is positive.

Answer: Positive correlation. Positive slope means both variables increase together.

Flashcard 37: Find the strength: Correlation coefficient is 0.

Answer: No correlation. Zero means no linear relationship exists between the variables.

Flashcard 38: Find the correlation: Points trend upwards.

Answer: Positive correlation. Upward trend indicates both variables increase together.

Flashcard 39: What does a correlation coefficient of 1 indicate?

Answer: Perfect positive linear relationship. All points lie exactly on an upward-sloping line.

Flashcard 40: What is extrapolation in the context of scatter plots?

Answer: Predicting values outside the range of the data. Extends the trend line beyond the given data points.

Flashcard 41: What is a bivariate relationship?

Answer: A relationship involving two variables. Scatter plots specifically examine two-variable relationships.

Flashcard 42: What does a positive correlation in a scatter plot indicate?

Answer: As one variable increases, the other variable also increases. Both variables move in the same direction together.

Flashcard 43: What does a shallow slope indicate in a scatter plot?

Answer: A weak relationship between the variables. Small changes in y correspond to changes in x.

Flashcard 44: What is the primary purpose of a scatter plot?

Answer: To display the relationship between two quantitative variables. Shows how two numerical variables relate or change together.

Flashcard 45: What does a correlation coefficient of -1 indicate?

Answer: Perfect negative linear relationship. All points lie exactly on a downward-sloping line.

Flashcard 46: How is the line of best fit determined?

Answer: By minimizing the distances from all points to the line. Uses least squares method to minimize total squared distances.

Flashcard 47: What is the purpose of a trend line in a scatter plot?

Answer: To show the general direction or pattern of the data. Helps visualize the overall relationship and make predictions.

Flashcard 48: Choose the correct term: Relationship measured by 'r' value.

Answer: Correlation coefficient. The rr value measures strength and direction of correlation.

Flashcard 49: Choose the correlation: Slope is zero.

Answer: No correlation. Zero slope means y doesn't change as x changes.

Flashcard 50: Find the correlation: Points trend upwards.

Answer: Positive correlation. Upward trend indicates both variables increase together.

Flashcard 51: Find and correct the error: Points tightly clustered indicate weak correlation.

Answer: Correct: indicate strong correlation. Tightly clustered points show strong, not weak correlation.

Flashcard 52: What is a residual in a scatter plot?

Answer: The difference between observed and predicted values. Measures how far each point deviates from the trend line.

Flashcard 53: Identify the tool used to draw a line of best fit.

Answer: Linear regression. Method that creates the best-fitting line through data points.

Flashcard 54: Find the correlation: Points are scattered randomly.

Answer: No correlation. Random scatter indicates no predictable relationship between variables.

Flashcard 55: What does a correlation coefficient of 0 indicate?

Answer: No linear relationship. Variables are not linearly related to each other.

Flashcard 56: What does a positive correlation in a scatter plot indicate?

Answer: As one variable increases, the other variable also increases. Both variables move in the same direction together.

Flashcard 57: What does a steep slope indicate in a scatter plot?

Answer: A strong relationship between the variables. Large changes in y correspond to small changes in x.

Flashcard 58: Identify the y-axis on a scatter plot.

Answer: The vertical axis representing the dependent variable. Also called the dependent variable because it responds to changes in x.

Flashcard 59: Determine the correlation: points form a U-shape.

Answer: Non-linear relationship. The relationship follows a curved pattern, not a line.

Flashcard 60: Choose the correlation: Slope is positive.

Answer: Positive correlation. Positive slope means both variables increase together.

Flashcard 61: Identify the tool used to draw a line of best fit.

Answer: Linear regression. Method that creates the best-fitting line through data points.

Flashcard 62: Choose the correct term: Relationship measured by 'r' value.

Answer: Correlation coefficient. The rr value measures strength and direction of correlation.

Flashcard 63: Given a scatter plot with no discernible pattern, what is the correlation type?

Answer: No correlation. Random scatter with no clear pattern means variables are unrelated.

Flashcard 64: What does a shallow slope indicate in a scatter plot?

Answer: A weak relationship between the variables. Small changes in y correspond to changes in x.

Flashcard 65: How is the line of best fit determined?

Answer: By minimizing the distances from all points to the line. Uses least squares method to minimize total squared distances.

Flashcard 66: What does a negative correlation look like on a scatter plot?

Answer: Points trend downwards from left to right. As x increases, y decreases, showing an inverse relationship.

Flashcard 67: What is the role of outliers in a scatter plot?

Answer: Outliers are data points that deviate significantly from the trend. They can affect trend lines and correlation strength significantly.

Flashcard 68: Identify an outlier in a scatter plot.

Answer: A point that lies far from the general pattern of the data. Look for points that don't follow the main cluster or trend.

Flashcard 69: Identify the type of prediction: Beyond data range.

Answer: Extrapolation. Predicting outside the data range carries more uncertainty.

Flashcard 70: What is interpolation in the context of scatter plots?

Answer: Predicting values within the range of the data. Uses the trend line between existing data points.

Flashcard 71: Find the correlation: Points trend downwards.

Answer: Negative correlation. Downward trend indicates one variable decreases as the other increases.

Flashcard 72: Find the correlation: Points trend downwards.

Answer: Negative correlation. Downward trend indicates one variable decreases as the other increases.

Flashcard 73: What is the range of the correlation coefficient?

Answer: From -1 to 1. Values closer to ±1\pm 1 indicate stronger linear relationships.

Flashcard 74: What does it mean if a scatter plot shows no discernible pattern?

Answer: No correlation. The variables are not related in a predictable way.

Flashcard 75: What does a positive correlation look like on a scatter plot?

Answer: Points trend upwards from left to right. As x increases, y also increases, showing a positive relationship.

Flashcard 76: Identify the line that best represents the trend in a scatter plot.

Answer: Line of best fit (or trend line). Drawn through data points to show the overall pattern or trend.

Flashcard 77: Identify the type of correlation: points slope upward.

Answer: Positive correlation. As one variable increases, the other also increases.

Flashcard 78: Identify the line that best represents the trend in a scatter plot.

Answer: Line of best fit (or trend line). Drawn through data points to show the overall pattern or trend.

Flashcard 79: What is the line of best fit?

Answer: A straight line that best represents the data on a scatter plot. Also called a trend line, it summarizes the data's relationship.