Algebra 1 : How to graph a two-step inequality
Study concepts, example questions & explanations for Algebra 1


All Algebra 1 Resources
Example Questions
Example Question #1 : How To Graph A Two Step Inequality
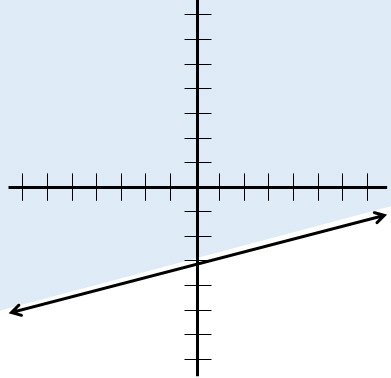
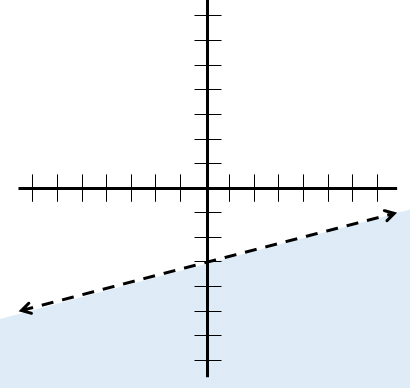
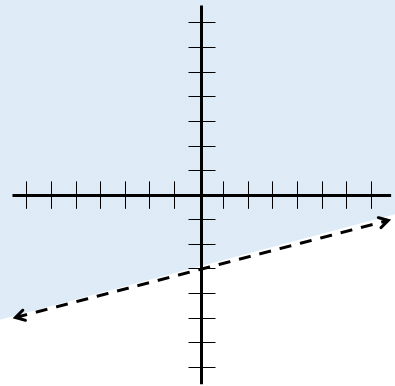
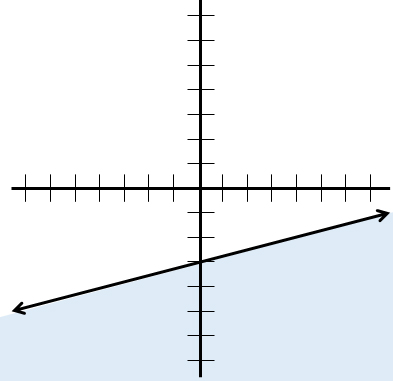
Which graph depicts the following inequality?

Possible Answers:
No real solution.
Correct answer:
Explanation:
Let's put the inequality in slope-intercept form to make it easier to graph:


The inequality is now in slope-intercept form. Graph a line with slope 

Because the inequality sign is greater than or equal to, a solid line should be used.
Next, test a point. The origin ")
-3\geq0")
The statement is false. Therefore, the section of the graph that does not contain the origin should be shaded.


All Algebra 1 Resources
Popular Subjects
MCAT Tutors in San Diego, LSAT Tutors in Miami, MCAT Tutors in San Francisco-Bay Area, Computer Science Tutors in Boston, Math Tutors in Phoenix, LSAT Tutors in Houston, MCAT Tutors in New York City, English Tutors in Denver, SAT Tutors in Chicago, Computer Science Tutors in Philadelphia
Popular Courses & Classes
Spanish Courses & Classes in New York City, SAT Courses & Classes in Philadelphia, LSAT Courses & Classes in New York City, GMAT Courses & Classes in San Francisco-Bay Area, ACT Courses & Classes in Los Angeles, ISEE Courses & Classes in Phoenix, GRE Courses & Classes in Denver, ACT Courses & Classes in Miami, GRE Courses & Classes in Dallas Fort Worth, SSAT Courses & Classes in Boston
Popular Test Prep
SSAT Test Prep in Dallas Fort Worth, ACT Test Prep in Miami, GMAT Test Prep in San Diego, ISEE Test Prep in San Diego, ACT Test Prep in San Francisco-Bay Area, GMAT Test Prep in Miami, GMAT Test Prep in San Francisco-Bay Area, SSAT Test Prep in Chicago, ACT Test Prep in Los Angeles, MCAT Test Prep in Atlanta

