AP Calculus AB : Limits of Functions (including one-sided limits)
Study concepts, example questions & explanations for AP Calculus AB


All AP Calculus AB Resources
Example Questions
Example Question #31 : Calculating Limits Using Algebra
Evaluate 


First, try evaluating the limit at the target value.

This gives us an indeterminate form, so we have to keep trying. Let's factor the polynomials:
^2}{(x+1)(x-1)}")
We can cancel an ")

Now evaluate at the target value.

The limit evaluates to 
Example Question #1 : Estimating Limits From Graphs Or Tables
Consider the function  = 10e^{-x} - x^{2}")


*5")
*4")
*20")
*1")
*2")
The mid-point Reimann sum is given by this formula:
*\Delta(x)")
 = \frac{20-0}{n}")

intervals. Thus, if the region from 


 = 2")

 = 4")


")

")
Example Question #2 : Estimating Limits From Graphs Or Tables
What is the ")
Does not exist


For this value, the Limit Laws can be applied:
=f(-1)=-1")
Example Question #171 : Functions, Graphs, And Limits
")
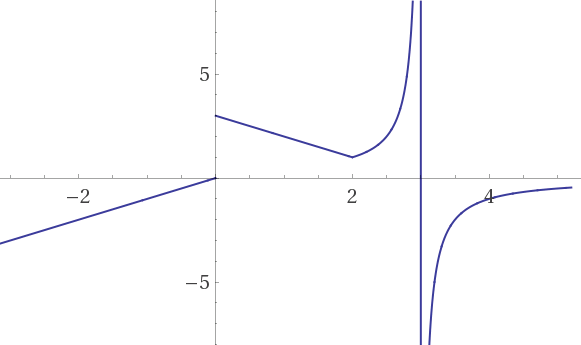
True or false: In the above graph of ")
")
True: The removable discontinuity does not affect the limit, and the right and left limits evaluate to 3.
False: We can't take the limit where the function isn't defined.
False: The left and right limits exist, but neither of them is three.
False: Both the left and right limits are three, but the regular limit isn't.
False: The left and right limits exist, but exactly one of them isn't three.
True: The removable discontinuity does not affect the limit, and the right and left limits evaluate to 3.
Removable discontinuities don't affect the limiting process. The limit process is essentially saying "As you get arbitrarily close to 


Graphically, we can see that the left and right limits are both three. If you trace the graph from either the left or right of 

By definition, if both the right and left limit evaluate to the same thing, the actual limit must agree. It's not possible for both of them to be three, but for the limit to disagree with them (at least in a two dimensional graph!)
Thus the correct answer is that the limit exists, and is three.
Example Question #1126 : Ap Calculus Ab
")
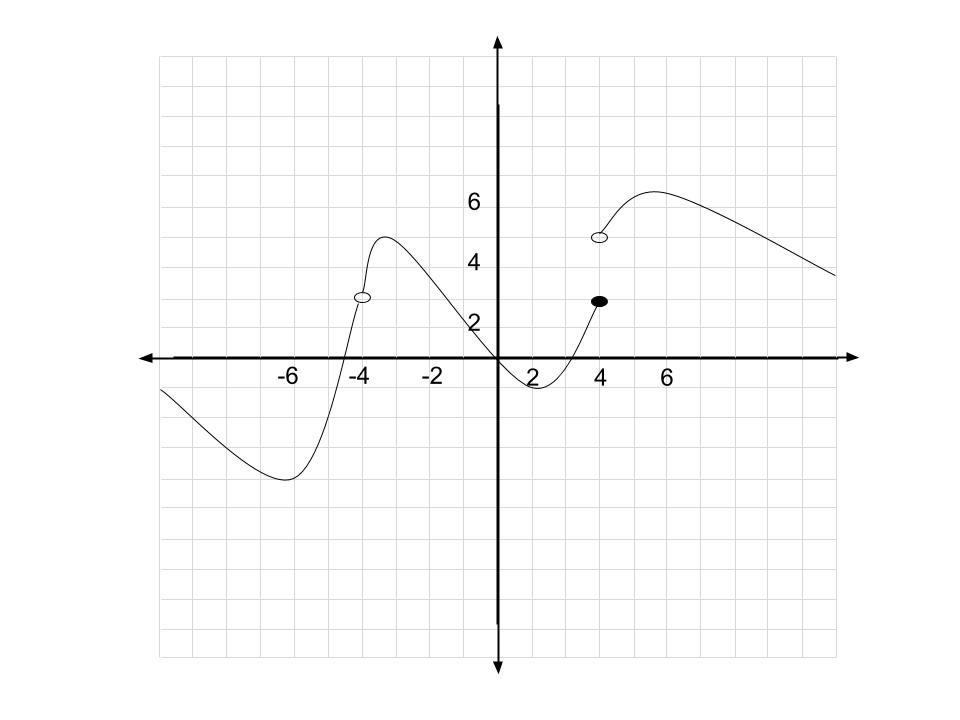
In the above graph of ")
")
")
")
 =5")
 =3")
 = 3")
 =3")
 =3")
 = 3")
 =3")
 =5")
 \: \mathrm{Does \: Not \: Exist}")
 \: \mathrm{Does \: Not \: Exist}")
 =3")
 \: \mathrm{Does \: Not \: Exist}")
 =5")
 =3")
 \: \mathrm{Does \: Not \: Exist}")
A right limit is found graphically by starting at a point to the right of the specified x value and tracing along the graph to the left until you hit the specified x. Regardless of whether or not the function is defined, or perhaps if its defined, but not where your finger ends up, your finger should be at the limit. This is because limits don't concern themselves with what happens at the specified x value. For right limits, we're essentially asking "If I get arbitrarily close to 
")
The same holds true for left limits, but you approach them from the other side.
In this problem, ")


")


Lastly, a regular limit is defined when both the right and left limits are defined and equal. In this case, the right limit is 5 and the left limit is 3, so the regular limit does not exist
Example Question #171 : Functions, Graphs, And Limits
Find the derivative.
y = sec (5x3)
y' = –csc(5x3)cot(5x3)
y' = sec(5x3)tan(5x3)(15x2)
y' = –sec(5x3)tan(5x3)(15x2)
y' = sec(5x3)tan(5x3)
y' = –csc(5x3)cot(5x3)(15x2)
y' = sec(5x3)tan(5x3)(15x2)
The derivative of the function y = sec(x) is sec(x)tan(x). First take the derivative of the outside of the function: y = sec(4x3) : y' = sec(5x3)tan(5x3). Then take the derivative of the inside of the function: 5x3 becomes 15x2. So your final answer is: y' = ec(5x3)tan(5x3)15x2
Example Question #2 : Understanding The Limiting Process.
Find the slope of the tangent line to the graph of f at x = 9, given that f(x) = –x2 + 5√(x)
18 + (5/6)
–18
–18 + (5/6)
–18 – (5/6)
18
–18 + (5/6)
First find the derivative of the function.
f(x) = –x2 + 5√(x)
f'(x) = –2x + 5(1/2)x–1/2
Simplify the problem
f'(x) = –2x + (5/2x1/2)
Plug in 9.
f'(3) = –2(9) + (5/2(9)1/2)
= –18 + 5/(6)
Example Question #1 : Understanding The Limiting Process.
Find the derivative
(x + 1)/(x – 1)
(–2)/(x – 1)2
1
(–2)/(x + 1)2
(–2)/(x – 1)
(x + 1) + (x – 1)
(–2)/(x – 1)2
Rewrite problem.
(x + 1)/(x – 1)
Use quotient rule to solve this derivative.
((x – 1)(1) – (x + 1)(1))/(x – 1)2
(x – 1) – x – 1)/(x – 1)2
–2/(x – 1)2
Example Question #31 : Limits Of Functions (Including One Sided Limits)
")


Use the chain rule and the formula

Example Question #176 : Functions, Graphs, And Limits
Find the derivative of
=4(x^{3}-2x+11)(x-2)")


=16x^{3}-24x^{2}-16x+60")

")
The answer is =16x^{3}-24x^{2}-16x+60")
=4(x^{3}-2x+11)(x-2)")
=4(x^{4}-2x^{3}+-2x^{2}+4x+11x-22)")
=4x^{4}-8x^{3}-8x^{2}+60x-22")
=16x^{3}-24x^{2}-16x+60")


All AP Calculus AB Resources

