AP Statistics : Bivariate Data
Study concepts, example questions & explanations for AP Statistics


All AP Statistics Resources
Example Questions
Example Question #1 : How To Find Outliers
Use the following five number summary to determine if there are any outliers in the data set:
Minimum:

Q1:

Median:

Q3:

Maximum:

There is at least one outlier on the low end of the distribution and no outliers on the high end of the distribution.
There is at least one outlier on the high end of the distribution and no outliers on the low end of the distribution.
There are no outliers.
It is not possible to determine if there are outliers based on the information given.
There is at least one outlier on the high end of the distribution and at least one outlier on the low end of the distribution.
There are no outliers.
An observation is an outlier if it falls more than ")
")

= 11..5(6)= 9")


Example Question #1 : How To Find Outliers
For a data set, the first quartile is 


Based on this information, a new observation can be considered an outlier if it is greater than what?


Use the 
This states that anything less than 

Thus, we want to find


 =1.5\cdot 30=45")
 = 70 + 45 = 115")
Therefore, any new observation greater than 115 can be considered an outlier.
Example Question #11 : Bivariate Data
You are given the following information regarding a particular data set:
Q1:

Q3:

Assume that the numbers 

None of the numbers are outliers
Four
Three
One
Two
Two
In order to find the outliers, we can use the 


Only two numbers are outside of the calculated range and therefore are outliers: 

Example Question #2 : How To Find Outliers
Use the following five number summary to answer the question below:
Min:

Q1:

Med:

Q3:

Max:

Which of the following is true regarding outliers?
There is only one outlier in this entire data set.
There are no outliers in the upper side of the data set, but there is at least one outlier on the lower side of the data set.
There is at least one outlier in the lower side of the data set and at least one outlier in the upper side of the data set.
There are no outliers in this data set.
There are no outliers in the lower side of the data set, but there is at least one outlier on the upper side of the data set.
There is at least one outlier in the lower side of the data set and at least one outlier in the upper side of the data set.
Using the 


This allows us to determine that there is at least one outlier in the upper side of the data set and at least one outlier in the lower side of the data set. Without any more information, we are not able to determine the exact number of outliers in the entire data set.
Example Question #3 : How To Find Outliers

Which values in the above data set are outliers?
no outliers


Step 1: Recall the definition of an outlier as any value in a data set that is greater than 

Step 2: Calculate the IQR, which is the third quartile minus the first quartile, or 


Step 3: 

Example Question #1 : How To Find Outliers
A certain distribution has a 1st quartile of 8 and a 3rd quartile of 16. Which of the following data points would be considered an outlier?


An outlier is any data point that falls 


Example Question #271 : Ap Statistics
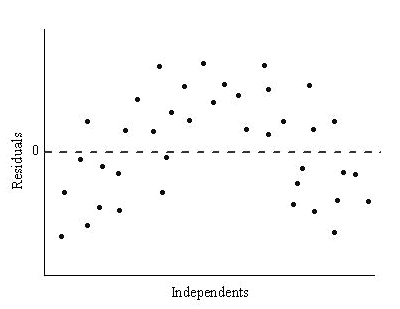
On a residual plot, the 

independent variable; the dependent variable


residuals; the independent variable
independent variable;

dependent variable; residuals
independent variable;
A residual plot shows the difference between the actual and expected value, or residual. This goes on the y-axis. The plot shows these residuals in relation to the independent variable.
Example Question #1 : How To Do Logarithmic Transformations
Example Question #272 : Ap Statistics
What transformation should be done to the data set, with its residual shown below, to linearize the data?
Nothing, the data set is already linear
multiply the dependent variable by a constant k.
multiply the independent variable by

take the log of the dependent variable
Add 
take the log of the dependent variable
Taking the log of a data set whose residual is nonrandom is effective in increasing the correleation coefficient and results in a more linear relationship.


All AP Statistics Resources

