AP Statistics : Graphing Data
Study concepts, example questions & explanations for AP Statistics


All AP Statistics Resources
Example Questions
Example Question #1 : How To Interpret Histograms
Louie collected the following data on sleeping habits of his classmates:
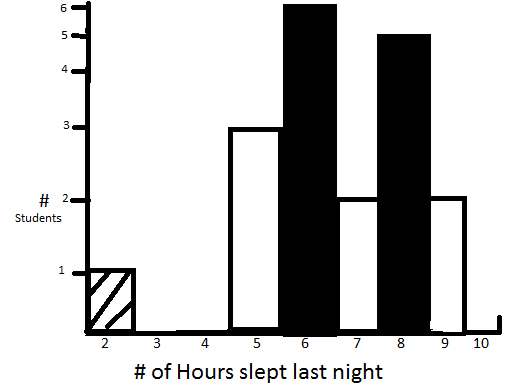
Calculate the median, 1st and 3rd quartile (Q1 and Q3) and mode for the data. There are 19 students in the class.
Possible Answers:
Median:7 Q1:6 Q3:9 Mode:8
Median:7 Q1:6 Q3:8 Mode:6
Median:6 Q1:5 Q3:8 Mode:6
Median:6 Q1:6 Q3:8 Mode:6
Median:6 Q1:5 Q3:9 Mode:8
Correct answer:
Median:6 Q1:6 Q3:8 Mode:6
Explanation:
graphing the data, or counting the quarter and halfway points at 10, 15 and 5, results in Q1 and the median both being 6, while Q3 is 8. 6 is the most common value so it is the mode


All AP Statistics Resources
Popular Subjects
Biology Tutors in Dallas Fort Worth, Math Tutors in Philadelphia, Statistics Tutors in Phoenix, ISEE Tutors in San Francisco-Bay Area, Reading Tutors in Houston, Reading Tutors in Philadelphia, Computer Science Tutors in Phoenix, English Tutors in Los Angeles, ISEE Tutors in Chicago, Biology Tutors in Atlanta
Popular Courses & Classes
GRE Courses & Classes in Boston, SSAT Courses & Classes in Washington DC, SAT Courses & Classes in San Francisco-Bay Area, ACT Courses & Classes in San Francisco-Bay Area, MCAT Courses & Classes in Philadelphia, GMAT Courses & Classes in Dallas Fort Worth, Spanish Courses & Classes in San Francisco-Bay Area, ISEE Courses & Classes in Los Angeles, MCAT Courses & Classes in Atlanta, ACT Courses & Classes in Seattle
Popular Test Prep
ISEE Test Prep in Atlanta, SAT Test Prep in Seattle, GMAT Test Prep in Washington DC, SSAT Test Prep in Chicago, GRE Test Prep in New York City, ACT Test Prep in San Francisco-Bay Area, LSAT Test Prep in New York City, MCAT Test Prep in Phoenix, GMAT Test Prep in Dallas Fort Worth, MCAT Test Prep in Philadelphia

