Create an account to track your scores
and create your own practice tests:
Test: ISEE Lower Level Quantitative
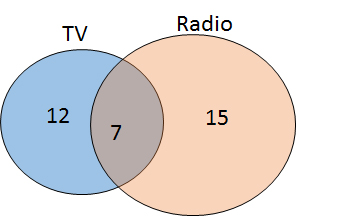
| 1. | Students were asked if they prefer TV or radio. The following Venn Diagram depicts the number of students who said TV, radio, or both. How many students like both TV and radio?
|
7
22
15
12


Popular Subjects
ISEE Tutors in Chicago, Computer Science Tutors in Atlanta, Statistics Tutors in Houston, Chemistry Tutors in Houston, Physics Tutors in Los Angeles, Computer Science Tutors in Phoenix, GRE Tutors in Philadelphia, SSAT Tutors in Denver, Computer Science Tutors in Philadelphia, Computer Science Tutors in Dallas Fort Worth
Popular Courses & Classes
GMAT Courses & Classes in San Diego, MCAT Courses & Classes in Boston, ACT Courses & Classes in Phoenix, LSAT Courses & Classes in Los Angeles, SSAT Courses & Classes in San Francisco-Bay Area, SSAT Courses & Classes in Philadelphia, GRE Courses & Classes in Philadelphia, SAT Courses & Classes in Chicago, SAT Courses & Classes in Boston, SAT Courses & Classes in Seattle
Popular Test Prep
MCAT Test Prep in Atlanta, SAT Test Prep in New York City, ISEE Test Prep in San Diego, SAT Test Prep in San Diego, GRE Test Prep in Houston, GMAT Test Prep in Philadelphia, GRE Test Prep in Dallas Fort Worth, SAT Test Prep in Seattle, SAT Test Prep in Chicago, ACT Test Prep in Phoenix

