Common Core: 1st Grade Math : Representing and Interpreting Data
Study concepts, example questions & explanations for Common Core: 1st Grade Math


All Common Core: 1st Grade Math Resources
Example Questions
Example Question #213 : Data Analysis And Probability
Look at the chart below. How many more pencils are there than pens?


There are 


Example Question #214 : Data Analysis And Probability
Look at the chart below. How many more pencils are there than markers?


There are 


Example Question #215 : Data Analysis And Probability
Look at the chart below. If we add 


There are 


Example Question #216 : Data Analysis And Probability
Look at the chart below. If we add 


We have 


Example Question #217 : Data Analysis And Probability
Look at the chart below. If we take away 


We have 


Example Question #218 : Data Analysis And Probability
Look at the chart below. If we add 


There are 


Example Question #111 : How To Find The Answer From A Table
Look at the chart below. What is there the least of?

Spoons
Forks
Knives
Forks
The bar for spoons goes up to 


Example Question #112 : How To Find The Answer From A Table
Look at the chart below. What is there the least of?
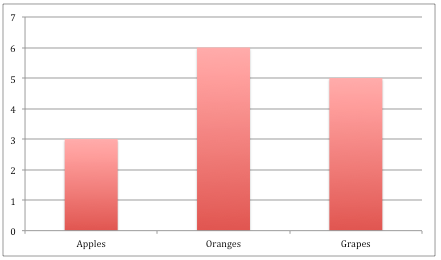
Grapes
Apples
Oranges
Apples
There are 


All Common Core: 1st Grade Math Resources

