Common Core: 3rd Grade Math : Measurement & Data
Study concepts, example questions & explanations for Common Core: 3rd Grade Math


All Common Core: 3rd Grade Math Resources
Example Questions
Example Question #15 : Representing And Interpreting Data
Use the chart below to answer the question.

How many more students have a sibling in the first grade group than the fourth grade group?


Each square represents 


To find the difference we subtract.

Example Question #16 : Representing And Interpreting Data
Use the chart below to answer the question.
How many more students have a sibling in the fourth grade group than the third grade group?


Each square represents 


To find the difference we subtract.

Example Question #17 : Representing And Interpreting Data
Use the chart below to answer the question.
How many more students have a sibling in the second grade group than the third grade group?


Each square represents 


To find the difference we subtract.

Example Question #18 : Representing And Interpreting Data
Use the chart below to answer the question.
How many more students have a sibling in the second grade group than the first grade group?


Each square represents 


To find the difference we subtract.

Example Question #161 : Measurement & Data
Use the chart below to answer the question.
How many more students have a sibling in the second grade group than the fourth grade group?


Each square represents 


To find the difference we subtract.

Example Question #22 : Representing And Interpreting Data
Use the chart below to answer the question.
How many students have a sibling in the fourth grade group and the third grade group?


Each square represents 


To find the total in both grades we add.

Example Question #162 : Measurement & Data
Use the chart below to answer the question.
How many students have a sibling in the second grade group and the first grade group?


Each square represents 


To find the total in both grades we add.

Example Question #224 : How To Find The Answer From A Table
Use the chart below to answer the question.
How many students in fourth grade have a sibling?


Each square represents 


Example Question #1 : Geometric Measurement: Understanding Concepts Of Area And Relating Area To Multiplication And To Addition
How many square units make up the area of the shape below?
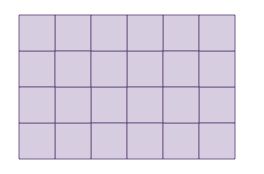


The shape is made up of unit squares. We can count the number of squares within the shape to find the area.
There are 
Example Question #2 : Geometric Measurement: Understanding Concepts Of Area And Relating Area To Multiplication And To Addition
How many square units make up the area of the shape below?
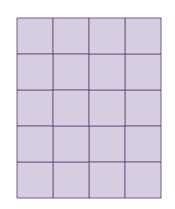


The shape is made up of unit squares. We can count the number of squares within the shape to find the area.
There are 


All Common Core: 3rd Grade Math Resources

