GED Math : Line Graphs
Study concepts, example questions & explanations for GED Math


All GED Math Resources
Example Questions
Example Question #261 : Statistics
The following graph charts the number of attendees at a theme park over the course of a year.
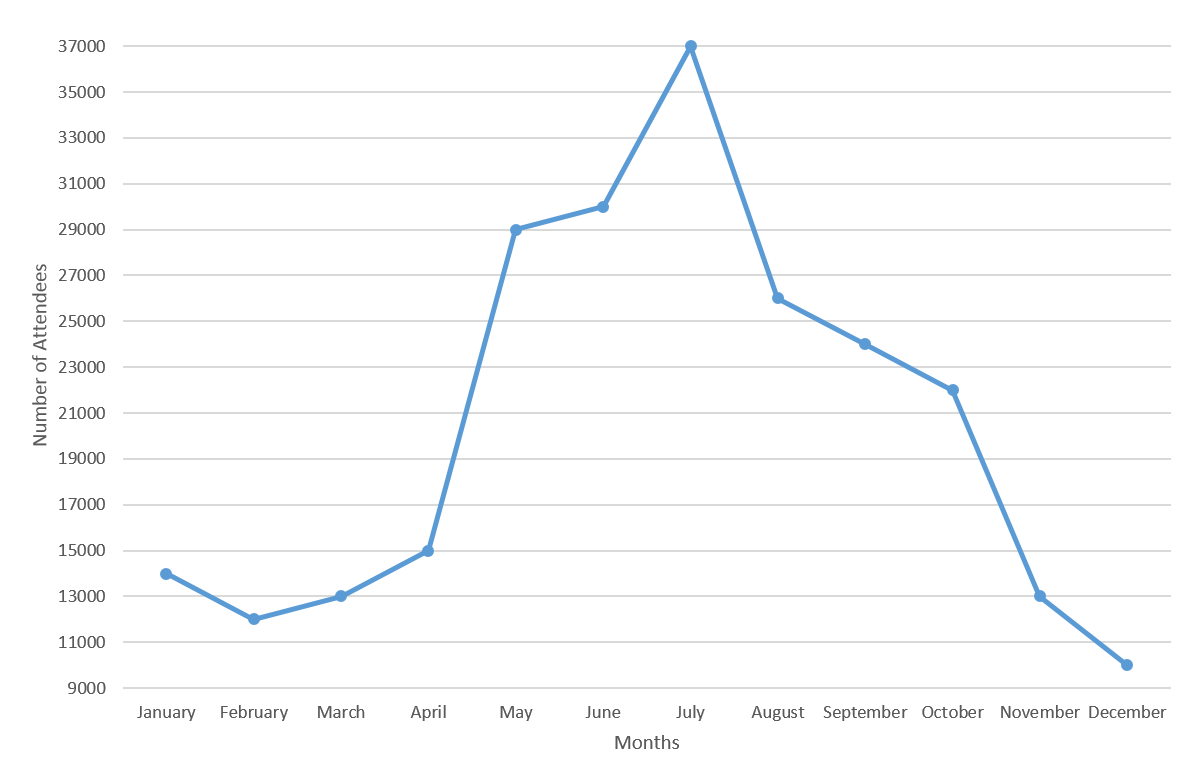
What is the average number of attendees from March to August, inclusive?
Possible Answers:


Correct answer:
Explanation:
Start by figuring out how many people attended the park in those months:
| March | 13000 |
| April | 15000 |
| May | 29000 |
| June | 30000 |
| July | 37000 |
| August | 26000 |
Recall how to find the average for a set of numbers:

Plug in the values for each of the months and divide by the number of months.


Darnell
Certified Tutor
Certified Tutor
University of Maryland, Bachelor of Education, Elementary School Teaching. Johns Hopkins University, Masters in Education, Ed...

Jason
Certified Tutor
Certified Tutor
NJCU, Bachelor in Arts, Communication, General. Saint Peters College, Masters in Business Administration, Elementary and Midd...

All GED Math Resources
Popular Subjects
LSAT Tutors in Houston, Math Tutors in Washington DC, SAT Tutors in Philadelphia, Reading Tutors in Miami, GMAT Tutors in Philadelphia, ISEE Tutors in New York City, Biology Tutors in Seattle, ACT Tutors in New York City, Computer Science Tutors in New York City, English Tutors in Phoenix
Popular Courses & Classes
Spanish Courses & Classes in Miami, GRE Courses & Classes in Seattle, LSAT Courses & Classes in San Diego, ACT Courses & Classes in Denver, SSAT Courses & Classes in Boston, GMAT Courses & Classes in New York City, SAT Courses & Classes in Philadelphia, MCAT Courses & Classes in Miami, ACT Courses & Classes in Chicago, ISEE Courses & Classes in Dallas Fort Worth
Popular Test Prep
ISEE Test Prep in Dallas Fort Worth, LSAT Test Prep in San Diego, ACT Test Prep in Phoenix, ACT Test Prep in San Diego, GMAT Test Prep in Miami, LSAT Test Prep in San Francisco-Bay Area, GRE Test Prep in Phoenix, SAT Test Prep in Los Angeles, SAT Test Prep in New York City, GMAT Test Prep in New York City

