GED Math : Statistics
Study concepts, example questions & explanations for GED Math


All GED Math Resources
Example Questions
Example Question #2011 : Ged Math
Find the range of the numbers:


The range is the difference between the largest and smallest numbers given.
The largest number is negative 2.
The smallest number is negative 15.
Subtract both numbers.
 = 13")
The range is 
Example Question #201 : Calculations
Determine the range of the following numbers:


The range is the difference between the largest and smallest numbers.
The largest number is:

The smallest number is:

Subtract both numbers.
 = 8+6 = 14")
The answer is:

Example Question #2021 : Ged Math
Evaluate the range of the numbers:


The range is the difference between the largest and smallest numbers.
The largest number is 25.
The smallest numbers is:

Subtract both numbers.
 = 25+7 = 32")
The answer is:

Example Question #31 : Other Data Calculations
For a formal dinner that he is planning, James needs to choose among 


In order to find the total number of possibilities, we will need to multiply the number of choices together. Since we have 


There are 
Example Question #201 : Calculations
A basketball coach is trying to name a captain, a co-captain, and then a team manager from a pool of 


Starting with the captain, the coach will have 
Since the coach will have chosen the captain, there are 
Afterwards, the coach will only have 
Thus, multiply these numbers together to get the total number of combinations possible for these three positions.

Example Question #201 : Statistics
The sales of a construction supply company are shown for the first six months of a year:
\\ \hline January &412 \\ February & 514\\ March & 201\\ April & 502\\ May &339\\ June& 102\\ \hline\end{tabular}")
What is the percent change in sales between March and April?


Start by finding the amount that the sales increased from March to April.

To find the percent change, divide the amount increased by the original value from March, then multiply the value by 

Sales increased by 
Example Question #1 : Pie Charts
Approximately what percent of respondents prefers McDonald's?


The percentage of respondents who answered McDonald's is between 


Example Question #1 : Representing Data
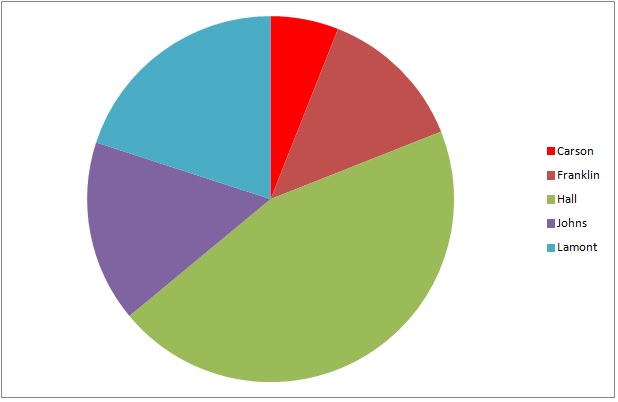
The above graph represents the results of the senior class election at Washington High. According to the rules, the candidate who receives the most votes will become the class president; the candidate who finishes second will become the class vice-president; the candidate who finishes third will become the class secretary-treasurer.
Who will be the secretary-treasurer?
Carson
Lamont
Franklin
Johns
Johns
The wedges, in descending order by size, are those representing Hall, Lamont, Johns, Franklin, Carson. Johns, therefore, finished third, and will be the secretary-treasurer.
Example Question #2 : Pie Charts
The above graph represents the results of the student body election at Big State College. According to the rules, if a candidate receives over 50% of the vote, (s)he will win outright. If no candidate receives over 50% of the vote, there will be a runoff election between the top two finishers.
Which of the following is the result of the election?
Hall and Lamont will face each other in a runoff.
Lamont won outright.
Hall won outright.
Hall and Johns will face each other in a runoff.
Hall and Lamont will face each other in a runoff.
The largest wedge of the circle graph is green, which, according to the legend, represents Hall. However, it is less than half of the graph, so he did not win outright. He will face his most successful opponent - Lamont, whose bright blue wedge is the second-largest (though not by much) - in a runoff.
Example Question #201 : Statistics
The above represents the results of a student council election at Jefferson High. According to the results, the top three finishers will be awarded seats on the student council.
Which two did not win a seat on the student council?
Lamont and Carson
Franklin and Carson
Franklin and Johns
Johns and Carson
Franklin and Carson
The wedges, in descending order by size, are those representing Hall, Lamont, Johns, Franklin, Carson. Hall, Lamont, and Johns were elected to the student council, so the correct choice is Franklin and Carson.

Certified Tutor

Certified Tutor

All GED Math Resources

