ISEE Primary 2 Math : Data Analysis and Probability
Study concepts, example questions & explanations for ISEE Primary 2 Math


All ISEE Primary 2 Math Resources
Example Questions
Example Question #10 : Isee Primary 2 Math
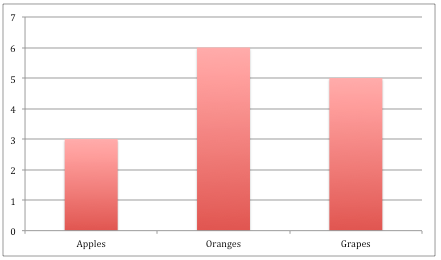
Look at the chart below. If we add 
Possible Answers:


Correct answer:
Explanation:
Looking at the graph, we first need to figure out how many apples we are starting with. We are starting with 


Example Question #11 : Isee Primary 2 Math
Look at the chart below. How many grapes are there?
Possible Answers:


Correct answer:
Explanation:
In the chart, grapes are shown in the last bar, on the right. That bar goes up to the number 


All ISEE Primary 2 Math Resources
Popular Subjects
SSAT Tutors in Chicago, Biology Tutors in Houston, ACT Tutors in San Diego, Statistics Tutors in Seattle, French Tutors in Houston, Statistics Tutors in Dallas Fort Worth, Calculus Tutors in Philadelphia, SSAT Tutors in Dallas Fort Worth, Computer Science Tutors in Miami, Reading Tutors in Atlanta
Popular Courses & Classes
Spanish Courses & Classes in Phoenix, SSAT Courses & Classes in Chicago, SSAT Courses & Classes in New York City, ISEE Courses & Classes in Chicago, GMAT Courses & Classes in Denver, GRE Courses & Classes in Philadelphia, Spanish Courses & Classes in Houston, LSAT Courses & Classes in Atlanta, SAT Courses & Classes in Dallas Fort Worth, Spanish Courses & Classes in Los Angeles
Popular Test Prep
SSAT Test Prep in Seattle, MCAT Test Prep in Philadelphia, ACT Test Prep in Miami, ACT Test Prep in Seattle, LSAT Test Prep in Chicago, GMAT Test Prep in Houston, SSAT Test Prep in San Francisco-Bay Area, LSAT Test Prep in Miami, MCAT Test Prep in Los Angeles, MCAT Test Prep in Miami

