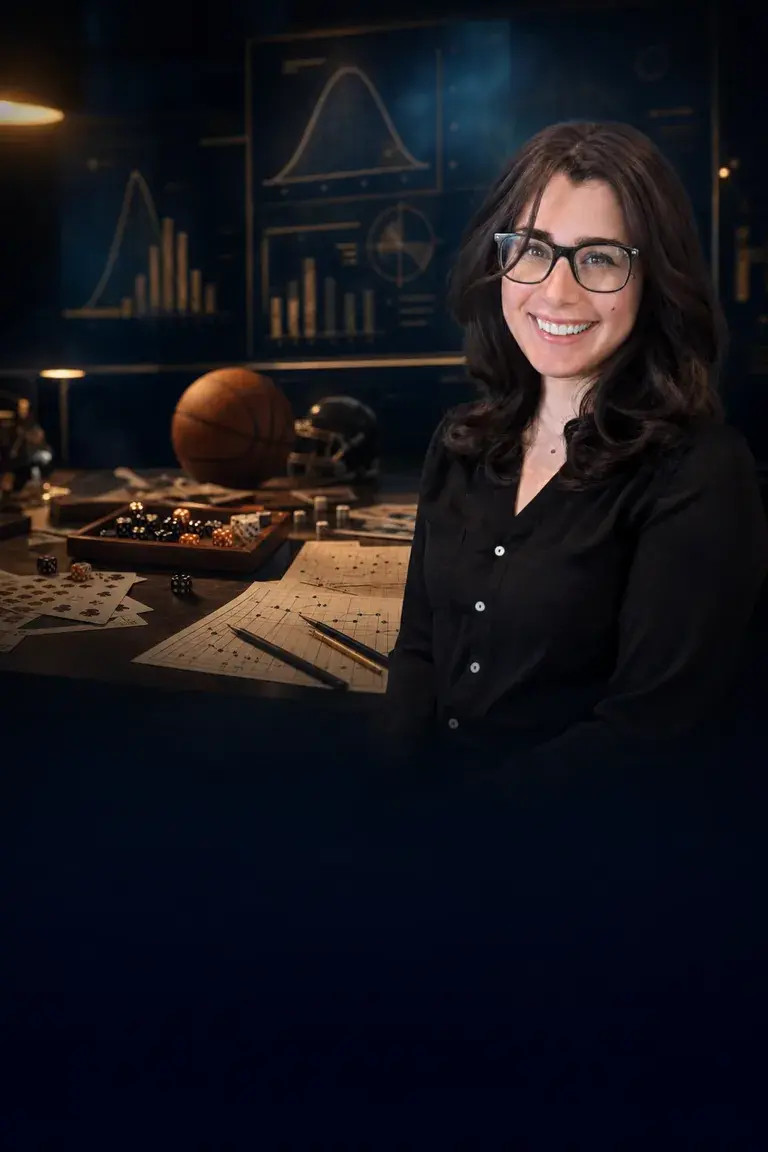
Practical Probability & Spirited Statistics
What are the odds of drawing a winning hand, and how does a fantasy football scoring system really work?
Starts Sat, Nov 21
5:00 PM UTC · 1h
4 sessions
Paige
4.6
Outcomes, not lecture notes.
Compound events: Calculate the odds of single and compound events
Dependent events: Tell independent from dependent events in a game
Counting: Use permutations and combinations to find the odds of a card hand
Data displays: Build and read histograms, box plots and scatter plots
Center and spread: Describe a data set with mean, median, range and spread
Sound conclusions: Spot misleading graphs, biased samples and false causes
Meet Paige.
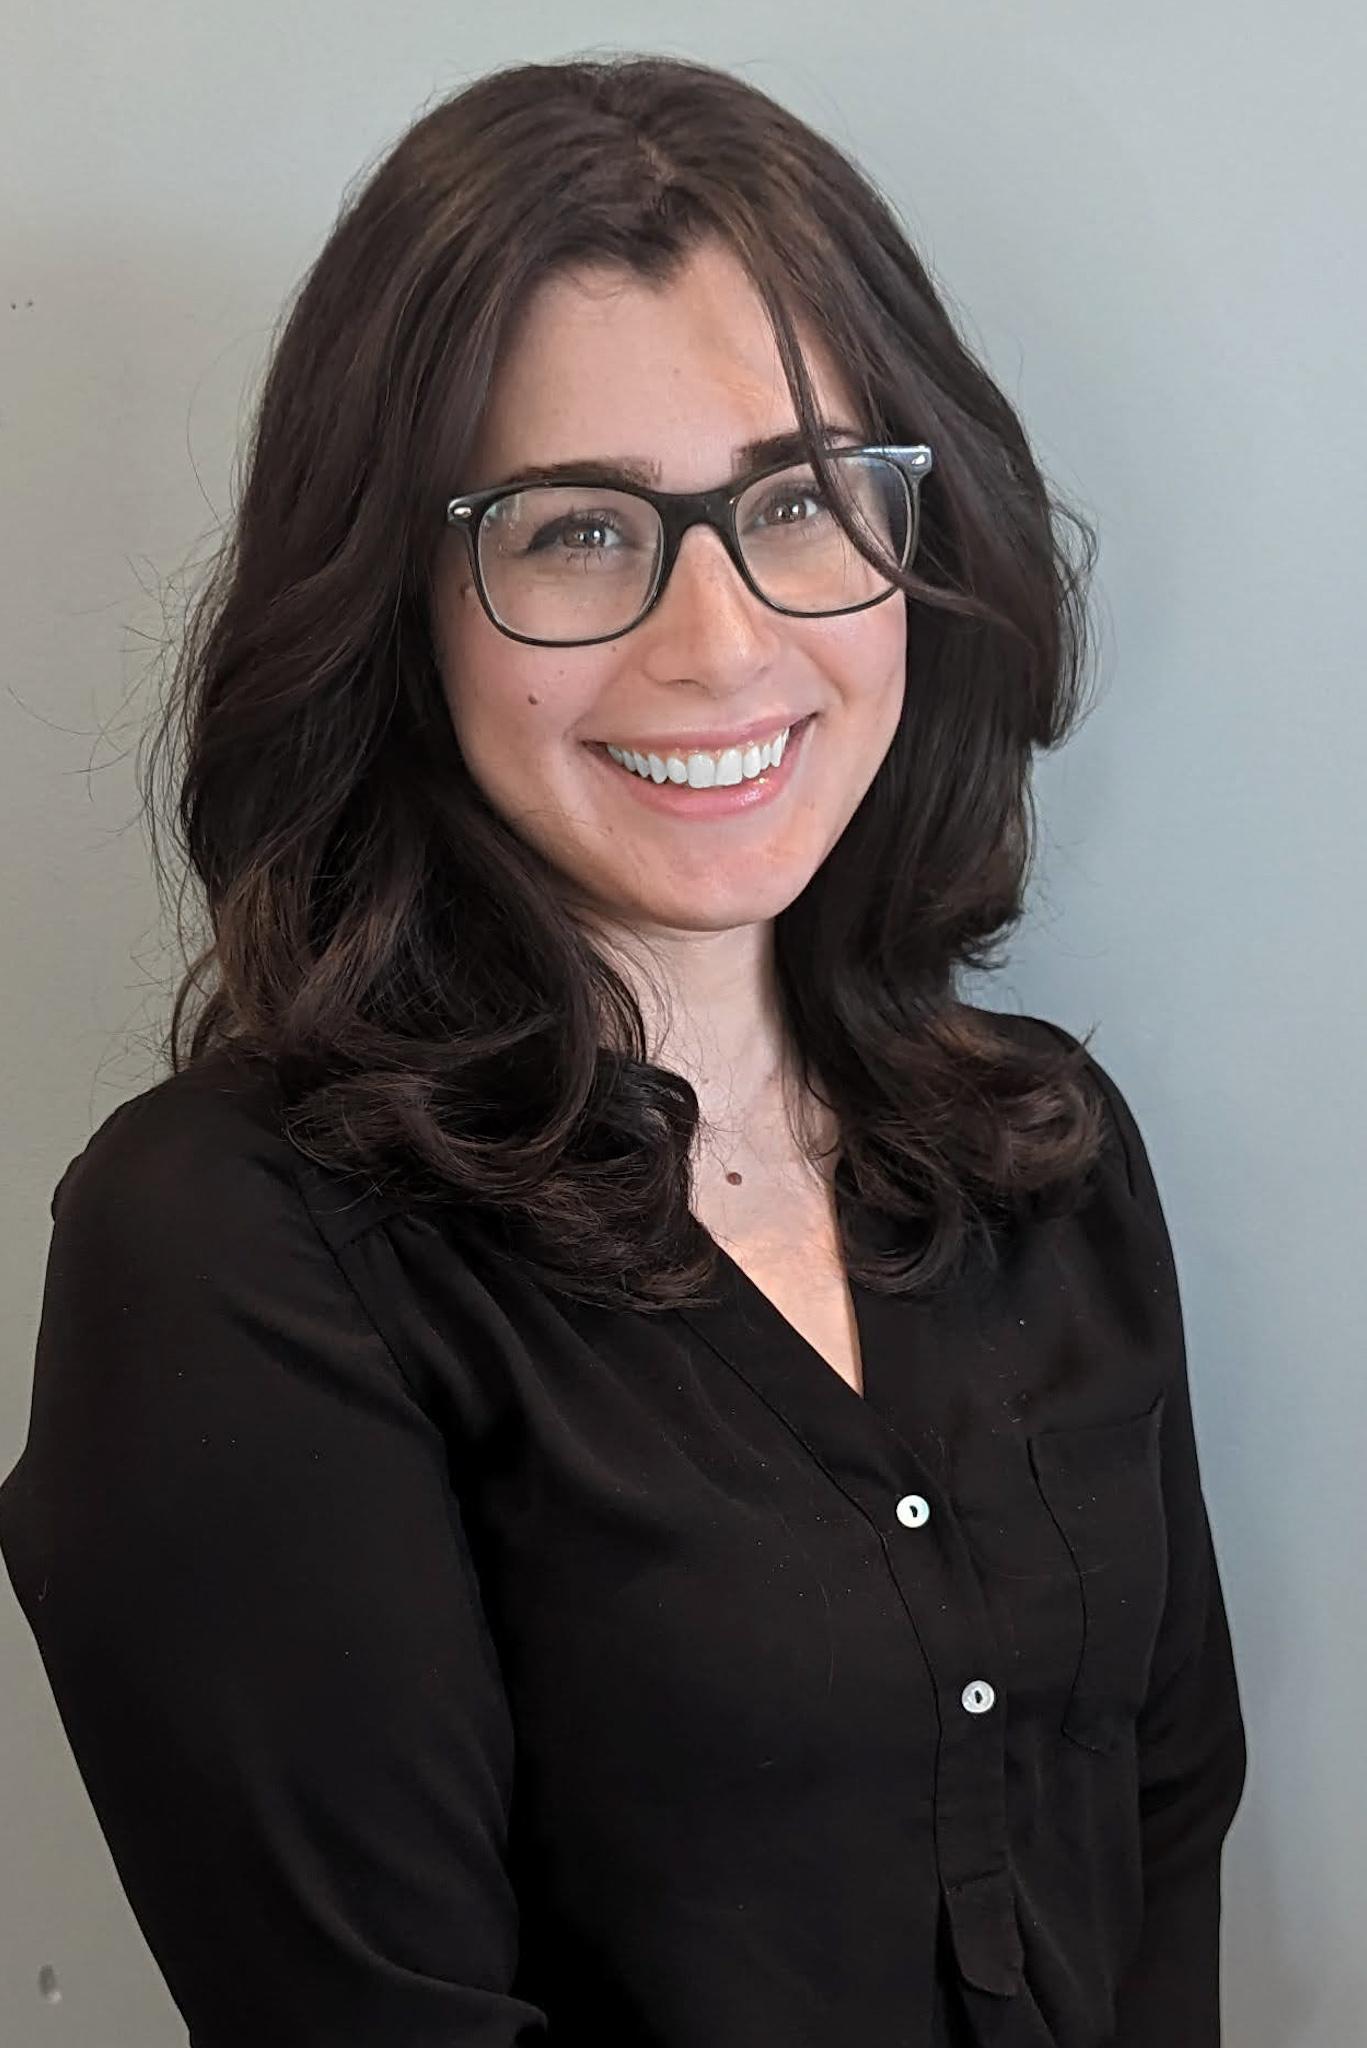
Paige
Focused on transforming standardized test outcomes, Paige Lavelle leverages her expertise in learning design to create innovative, interactive SAT and ACT lessons. Her personalized instruction breaks down complex test concepts into manageable strategies, empowering students to boost their scores and excel on exam day.
What are the odds of drawing a winning hand, and how does a fantasy football scoring system really work? In Practical Probability & Spirited Statistics, middle schoolers get hands-on with the math behind sports, games and entertainment, working through chances, counting and data with a live instructor and answering questions along the way. Every class leaves students able to use probability or statistics to make a smarter call in a game they love. For game lovers and sports fans who want to understand why the math works, not just memorize it.
Chance and Compound Events You calculate theoretical and experimental probability for single and compound events, sort independent from dependent outcomes, and apply conditional probability to problems that need careful reasoning.
Permutations and Combinations Counting techniques become tools for problems too big to work out by hand, like the odds of a winning hand in a card game, so you can approach probability systematically instead of guessing.
Reading Data Displays Build and interpret histograms, box plots, and scatter plots, and use mean, median, mode, range, and standard deviation to describe what a data set and its spread are telling you.
Correlation, Bias, and Sound Conclusions You learn to tell correlation from causation, spot misleading graphs and biased samples, and see how sample size affects whether a conclusion drawn from data can be trusted.
Live Q&A
Cameras / mics optional
Recordings
Available within 1 hour, kept 90 days
Materials
No special materials required
Similar classes



free with a Varsity Tutors membership
17
DAYS12
HRS38
MINSat, Nov 21 • 5:00pm UTC
4 classes, starts in 17 days
Sat, Feb 20 • 5:30pm UTC
4 classes, starts in 108 days
Sun, Apr 11 • 9:30pm UTC
4 classes, starts in 158 days
Practical Probability & Spirited Statistics