Pre-Calculus
Help Questions
Pre-Calculus › Pre-Calculus
Find the derivative of the function =x^{3}+5")
=3x^{2}")
=3x^{2}+5")
=3x^{3}")
=\frac{1}4{}x^{4}")
None of the above
Explanation
For any function =Ax^{n}")
=nAx^{n-1}")
Therefore, taking each term of ")
=x^{3}+5")
=3x^{3-1}+0(5)")
=3x^{2}")
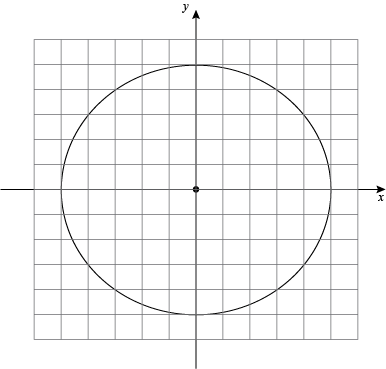
If each mark on the graph represents 


Explanation
Since the circle is centered at ")

Given the circle has a radius of 


We then plug in 

^2")

Solve for 
=2x^2")


")

")
Explanation
First, let's begin by simplifying the left hand side.


")

=1")

")
Now, our expression is

From this, we can cancel out the 2's and an x from both sides.
Thus our answer becomes:

Convert the polar coordinates to rectangular form:
")
")
")
")
")
Explanation
To convert polar coordinates ")
")


Using the information given in the question,
=-5")
=-5\sqrt3")
The rectangular coordinates are
")
Let


Determine the sum 

DNE


Explanation
Since the dimensions of the two matrices are equal the sum of the two matrices exists.
To find the sum, add each component entry from the first matrix to the same component entry of the second matrix.

Write the equation  ^2 = 4x^2 + 4y^2")


Explanation
First re-arrange the original equation so that the 4 is factored out on the right side, and put 

^2 = 4(x^2 + y^2)")
Make the substitutions 

^2 = 4r^2")


Write the parametric equation for the line y = 5x - 3.
x = 5t - 3
y = t
x = t
y = 5t - 3
x = 5t - 3
y = 5t - 3
x = t
y = t
Explanation
In the equation y = 5x - 3, x is the independent variable and y is the dependent variable. In a parametric equation, t is the independent variable, and x and y are both dependent variables.
Start by setting the independent variables x and t equal to one another, and then you can write two parametric equations in terms of t:
x = t
y = 5t - 3
Find 
")
")


Explanation
To find the direction vector going from 


Find 


Explanation
In order to find the derivative we will need to use the power rule on each term. The power rule states,
=x^n \rightarrow f'(x)=nx^{n-1}")
Applying this rule we get the following.

x^{5-1}+(3*3)x^{3-1}+(6*2)x^{2-1}+(1)'")


Which of the following functions is represented by this graph?
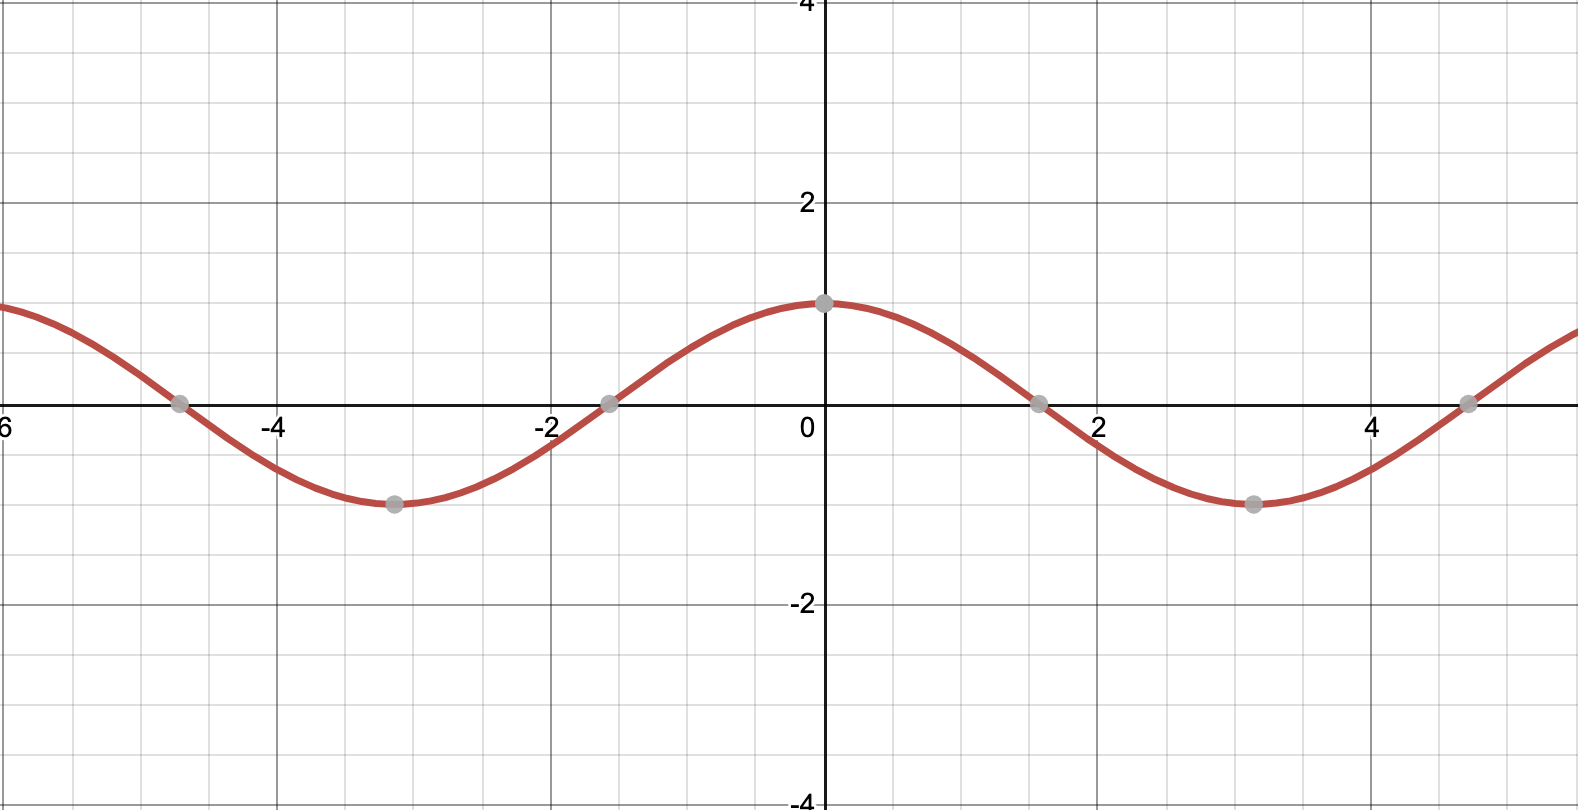
y = sin(x)
y = cos(x)
y = tan(x)
y = sec(x)
y = csc(x)
Explanation
This graph is the graph of y = cos x. The domain of this function is all real numbers. The range of this function is 
