SAT II Math II : Standard Deviation
Study concepts, example questions & explanations for SAT II Math II


All SAT II Math II Resources
Example Questions
Example Question #491 : Sat Subject Test In Math Ii
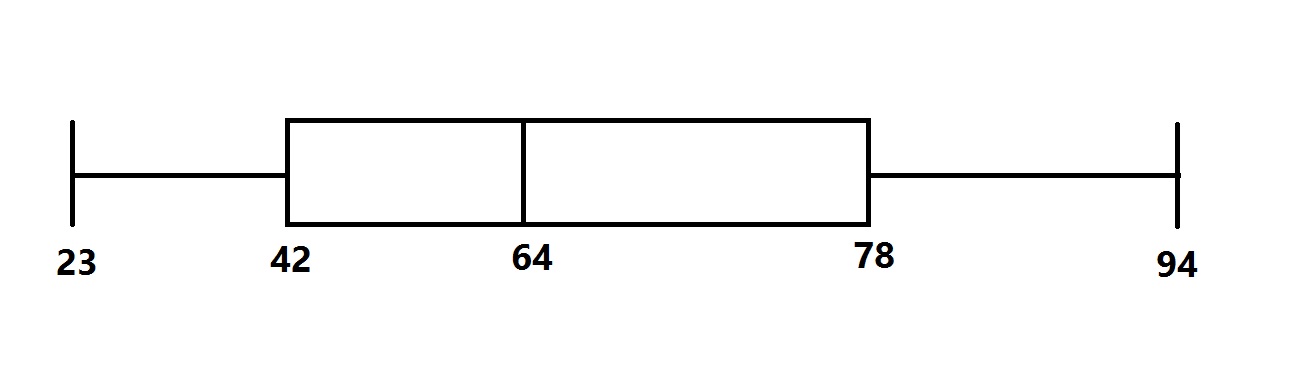
The distribution of scores for a test given to a large group of students is represented by the above box-and-whisker plot.
To the nearest whole number, what was the standard deviation of the scores?
Possible Answers:


Insufficient information is given to answer the question.


Correct answer:
Insufficient information is given to answer the question.
Explanation:
A box-and-whisker plot gives the lowest and highest scores and the three quartiles (including the median), which depend on the relative position of the scores. The standard deviation of the scores depends on the scores themselves, which are not reflected in the diagram. The question cannot be answered from the box-and-whisker plot.

Mithily
Certified Tutor
Certified Tutor
Osmania, Bachelor of Science, Mathematics. University of California-Santa Barbara, Master of Science, Computer Science.


All SAT II Math II Resources
Popular Subjects
Calculus Tutors in Washington DC, Math Tutors in San Francisco-Bay Area, GRE Tutors in Los Angeles, Chemistry Tutors in Dallas Fort Worth, MCAT Tutors in Philadelphia, Calculus Tutors in Phoenix, Spanish Tutors in Chicago, Computer Science Tutors in Miami, Biology Tutors in Boston, ISEE Tutors in Washington DC
Popular Courses & Classes
ACT Courses & Classes in Miami, MCAT Courses & Classes in Dallas Fort Worth, SSAT Courses & Classes in Philadelphia, ISEE Courses & Classes in Miami, ACT Courses & Classes in Chicago, ACT Courses & Classes in Denver, MCAT Courses & Classes in San Diego, SAT Courses & Classes in Atlanta, SAT Courses & Classes in Washington DC, ISEE Courses & Classes in Washington DC
Popular Test Prep
SAT Test Prep in Seattle, LSAT Test Prep in Atlanta, SSAT Test Prep in Boston, LSAT Test Prep in Chicago, ISEE Test Prep in Los Angeles, ACT Test Prep in Miami, SSAT Test Prep in San Francisco-Bay Area, GRE Test Prep in Houston, GMAT Test Prep in Chicago, GRE Test Prep in San Francisco-Bay Area

