SAT Mathematics : SAT Math
Study concepts, example questions & explanations for SAT Mathematics


All SAT Mathematics Resources
Example Questions
Example Question #6 : Finding Zeros
What is the sum of all unique zeros to the function =x^3+17x^2+72x")
8
72
17
-17
-17
The zeros of a function are the x-values at which the value of the function equals zero. So to solve for the zeros of a function, set the function equal to zero and then solve for 

Then factor the common 
=0")
Then factor the quadratic in parentheses:
(x+8)=0")
Now make sure you solve for 


Example Question #1 : Graphing Inequalities
For the following system of equations, what shape does the corresponding graph make:

Triangle
Square
It does not form a shape.
Rectangle
Triangle
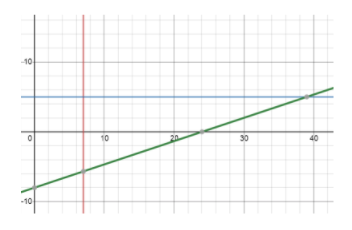
When we graph the three inequalities as equations, we get the below graph. Testing a point within the triangle does in fact fulfill all three conditions, so the shape formed by the inequalities is a triangle. If a tested point within the triangle did not fulfill one or more conditions, then we would have chosen “it does not form a shape.”
Example Question #2 : Graphing Inequalities
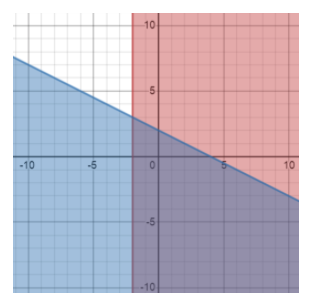
Which of the following graphs correctly describes the system of inequalities:


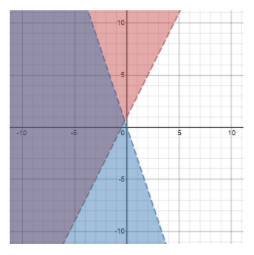
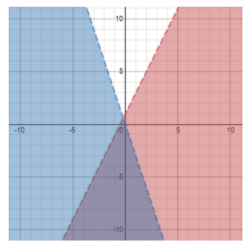
After plotting the lines, shade the regions corresponding to each individual inequality. The area of intersection (in purple) is the solution to the system of inequalities. Another way to check your answer is to pick a point in all four regions delineated by the two equations and test those four coordinate points in the system of inequalities.
Example Question #1 : Graphing Inequalities
For the following system of equations, what shape does the corresponding graph make:

It does not form a shape
Square
Rectangle
Triangle
Triangle
When we graph the three inequalities as equations, we get the below graph. Testing a point within the triangle does in fact fulfill all three conditions, so the shape formed by the inequalities is a triangle. If a tested point within the triangle did not fulfill one or more conditions, then we would have chosen “it does not form a shape.”
Example Question #3 : Graphing Inequalities
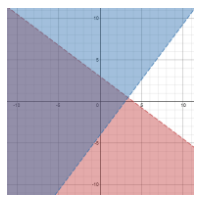
Which of the following graphs correctly describes the system of inequalities:


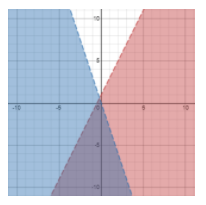
After plotting the lines, shade the regions corresponding to each individual inequality. The area of intersection (in purple) is the solution to the system of inequalities. Another way to check your answer is to pick a point in all four regions delineated by the two equations and test those four coordinate points in the system of inequalities.
Example Question #1 : Graphing Inequalities
Which of the following ordered pairs (x,y) is a solution to the system of inequalities:


")
")
")
")
This is the only coordinate point that fulfills the system of inequalities.
Example Question #4 : Graphing Inequalities
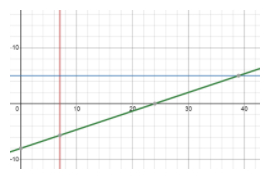
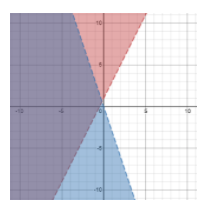
If the system of inequalities 

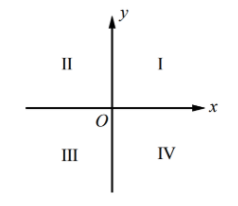
II
III
I
I and II
I and II
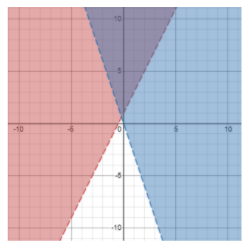
The graph of the system of inequalities is shown below. The solution (in purple) does not go into region I or II.
Example Question #2 : Graphing Inequalities
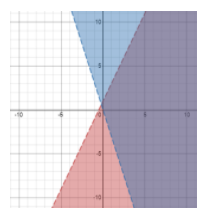
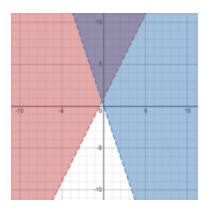
If the system of inequalities 

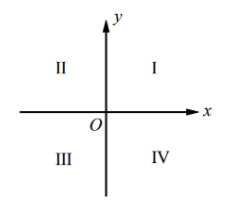
II
III
There are solutions in all 4 quadrants.
IV
There are solutions in all 4 quadrants.
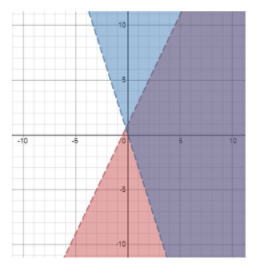
The graph of the system of inequalities is shown below. The solution (in purple) is present in all four regions.
Example Question #3 : Graphing Inequalities
If the system of inequalities 

There are solutions in all 4 quadrants.
IV
II
III
There are solutions in all 4 quadrants.
The graph of the system of inequalities is shown below. The solution (in purple) is present in all four regions.
Example Question #8 : Graphing Inequalities
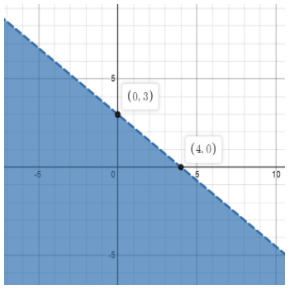
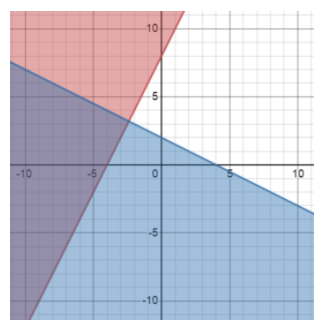
The graph shown above is best represented by which inequality?


The x-intercept is (4,0) so when 


+3(0)=0< 12")

Certified Tutor


All SAT Mathematics Resources

