SSAT Upper Level Math : SSAT Upper Level Quantitative (Math)
Study concepts, example questions & explanations for SSAT Upper Level Math


All SSAT Upper Level Math Resources
Example Questions
Example Question #13 : Data Analysis / Probablility
The menu of a local coffeehouse reads as follows:

A boss is treating his employees to drinks. Seven of them want iced tea, five want cafe latte, four want espresso, three want cappucino, one wants Americano, and one wants Turkish coffee. How much will the boss spend, disregarding tax?


Multiply each price by the quantity ordered:
Seven iced teas:

Five cafe lattes:

Four espressos:

Three cappucinos:

Add the $2.39 for the Americano and the $2.09 for the Turkish coffee. The sum:

Example Question #13 : Data Analysis / Probablility
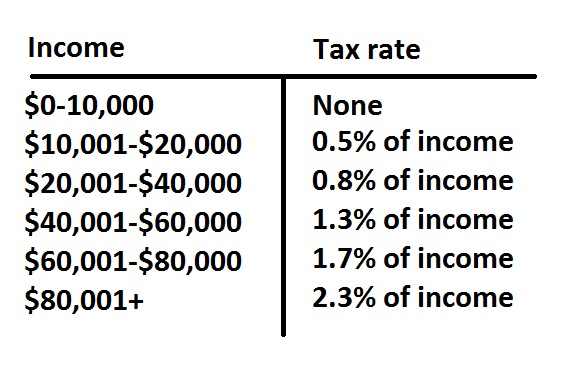
The above is an annual income tax table for married couples for a given state.
Mr. Phillips earned $27,287 last year; Mrs. Phillips earned $25,879. How much will the couple pay in income tax for that year (nearest hundred dollars)?


The Phillips's income totaled

This puts them in the 1.3% tax bracket, so they will pay

The correct response is $700.
Example Question #2 : How To Read Tables
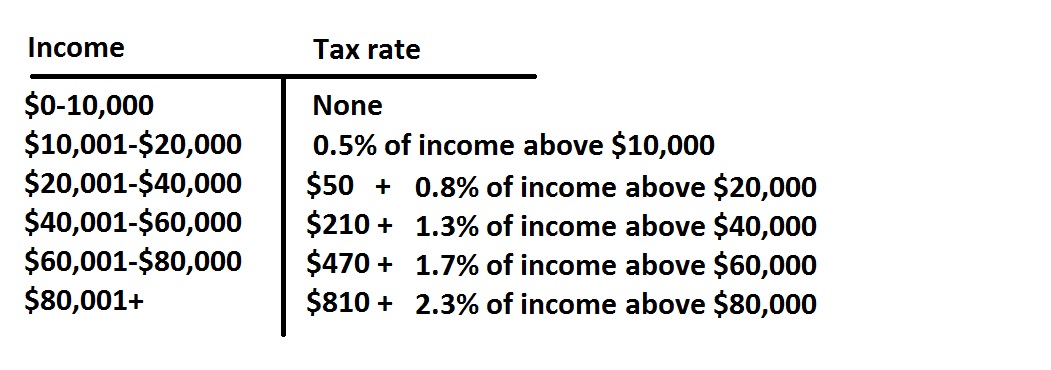
The above is an annual income tax table for single persons in a given state.
Grant earned $4,389 per month over a one-year period in his regular job. He also claimed $1,736 in interest income and $3,781 in stock dividends. Based on the above table, how much income tax will he pay (nearest dollar)?


Grant earned, in salary, interest, and dividends:

This puts him in the $40-60,000 range, so he will pay $210 plus 1.3% of his income above $40,000. This will be
 \times 0.013")


Example Question #15 : Data Analysis / Probablility
The above is an annual income tax table for single persons in a given state.
Mr. Wells, a single man, paid $690 in taxes last year. Which of the following amounts comes closest to his income for the year?


Since he paid between $470 and $810, his earnings had to have been in the $60,000 to $80,000 range.
Let 
 = 690")


The correct choice is $75,000.
Example Question #3 : How To Read Tables
The above is an annual income tax table for married couples for a given state.
Mr. Clarke earned a monthly salary of 


The correct answer is not among the other choices.


Mr. and Mrs. Clarke earned a total of

(noting that Mrs. Clarke worked for nine months)


This places them in the highest tax bracket, so they will pay $810 plus 2.3% of their income over $80,000:
 \times 0.023")


Round this to $2,756.
Example Question #1 : How To Read Tables
The above is an annual income tax table for single persons in a given state.
Michael earned 


From salary, interest, and dividends, Michael earned

putting him in the 1.3% tax bracket.
His income tax will be

making $500 the correct response.
Example Question #2 : How To Read Tables
What is the probability of rolling a single die and it landing on 2 and 4?


When you roll on die you can only get one possible value facing up. The expression "the probability of getting a 2 and 4" means that they both occur at the same time. Since you can not get two results with one die, the probability must be 
Example Question #2 : How To Read Tables
What is the probability of rolling a single die and it landing on 2 and 4?
When you roll on die you can only get one possible value facing up. The expression "the probability of getting a 2 and 4" means that they both occur at the same time. Since you can not get two results with one die, the probability must be
Example Question #3 : How To Read Tables
| Column1 | Column2 |
| 1 | 0 |
| 2 | 0 |
| 3 | 2 |
| 4 | 3 |
| 5 | 4 |
| 6 | 5 |
| 7 | 8 |
| 8 | 8 |
| 9 | 8 |
| 10 | 8 |
| 11 | 5 |
| 12 | 0 |
Looking the the table given above, what is the range of the data set?


The range of the data is the difference between the highest and lowest independent variable values.
In this set, the lowest is 

The difference between these two is 
Example Question #4 : How To Read Tables
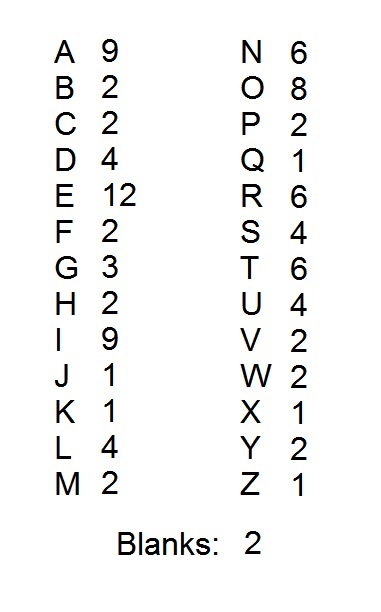
A popular word game uses one hundred tiles, each of which is marked with a letter or a blank. The distribution of the tiles is shown above, with each letter paired with the number of tiles marked with that letter. Notice that there are two blank tiles.
In the game, the four letters that are the most difficult to play are the "J", the "Q", the "X", and the "Z". John and Jane, who are in third grade, agree to remove these letters. After this is done, what percent of the letter tiles are marked with consonants (Note: "Y" counts as a consonant)?


The easiest way to count the consonants is to count the vowels and blanks first.
There are nine "A" tiles, twelve "E" tiles, nine "I" tiles, eight "O" tiles, four "U" tiles, and two "blanks". This is a total of

There are 96 tiles left after the removal of the "J", the "Q", the "X", and the "Z". Therefore, the number of consonants remaining is


This rounds to 54%.


All SSAT Upper Level Math Resources

