SSAT Elementary Level Math : Tables
Study concepts, example questions & explanations for SSAT Elementary Level Math


All SSAT Elementary Level Math Resources
Example Questions
Example Question #31 : Tables

Which student has the greatest sum of their 
Ashlea
Derek
Brenda
Connie
Ernie
Ernie
To find this answer, add together each student's math and english test scores to see which student has the greatest sum. Ernie recieved 
Example Question #32 : How To Find The Answer From A Table

How many students selected Spanish as their favorite subject?


To find this answer, look at the Favorite Subject column and see how many students selected Spanish as their favorite subject. No students selected Spanish, so the answer is

Example Question #172 : Data Analysis And Probability
Look at the chart below. What is there the most of?
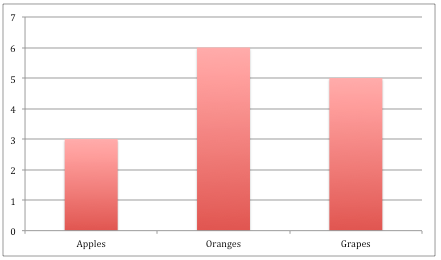
Grapes
Apples
Oranges
Oranges
There are 


Example Question #173 : Data Analysis And Probability
Look at the chart below. How many apples are there?


In the chart, apples are shown in the first bar. That bar goes up to the number 

Example Question #174 : Data Analysis And Probability
Look at the chart below. How many oranges are there?


In the chart, oranges are shown in the second bar. That bar goes up to the number 

Example Question #175 : Data Analysis And Probability
Look at the chart below. How many grapes are there?


In the chart, grapes are shown in the last bar. That bar goes up to the number 

Example Question #32 : Tables
Look at the chart below. How many more oranges are there than apples?


There are 


Example Question #2 : Organize, Represent, And Interpret Data: Ccss.Math.Content.1.Md.C.4
Look at the chart below. If we add 


We are starting with 


Example Question #177 : Data Analysis And Probability
Look at the chart below. If we add 


We are starting with 


Example Question #178 : Data Analysis And Probability
Look at the chart below. If we add 


We have 


Certified Tutor

Certified Tutor

All SSAT Elementary Level Math Resources

