SSAT Elementary Level Math : Data Analysis
Study concepts, example questions & explanations for SSAT Elementary Level Math


All SSAT Elementary Level Math Resources
Example Questions
Example Question #4 : Represent And Interpret Data
Use the line plot to answer the question.

Three students spend 


When we subtract mixed numbers we subtract the whole numbers by the whole numbers and the fractions by the fractions.


Example Question #5 : Represent And Interpret Data
Use the line plot to answer the question.
Two students spend 


When we subtract mixed numbers we subtract the whole numbers by the whole numbers and the fractions by the fractions.


Example Question #6 : Represent And Interpret Data
Use the line plot to answer the question.
Two students spend 


When we subtract mixed numbers we subtract the whole numbers by the whole numbers and the fractions by the fractions.


Example Question #7 : Represent And Interpret Data
Use the line plot to answer the question.
Two students spend 


When we subtract mixed numbers we subtract the whole numbers by the whole numbers and the fractions by the fractions.


Example Question #8 : Represent And Interpret Data
Use the line plot to answer the question.
Two students spend 


When we subtract mixed numbers we subtract the whole numbers by the whole numbers and the fractions by the fractions.


Example Question #9 : Represent And Interpret Data
Use the line plot to answer the question.
Two students read 


When we add mixed numbers we add the whole numbers to the whole numbers and the fractions to the fractions.


Example Question #111 : Tables
Use the line plot to answer the question.
Three students read 


When we add mixed numbers we add the whole numbers to the whole numbers and the fractions to the fractions.


Example Question #111 : Tables
Which class has the fewest number of boys in it?

Ms. Jones
Ms. Williams
Ms. Melton
Ms. Smith
Ms. Williams
We must compare all of the numbers in the "boys" column.
When we do this, we see that Ms. Williams has the smallest number of boys in her class.

Example Question #112 : Tables
Look at the chart below. What is there the least of?

Knives
Spoons
Forks
Forks
The bar for spoons goes up to 


Example Question #251 : Data Analysis And Probability
Look at the chart below. What is there the least of?
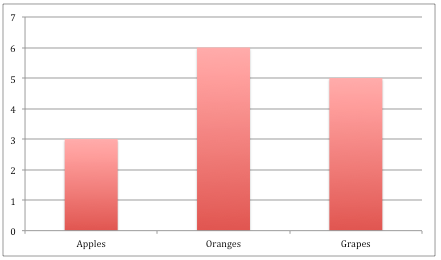
Apples
Grapes
Oranges
Apples
There are 


All SSAT Elementary Level Math Resources

